Yannis Galanakis
Data Visuals with R
A collection of visuals I like by various authors
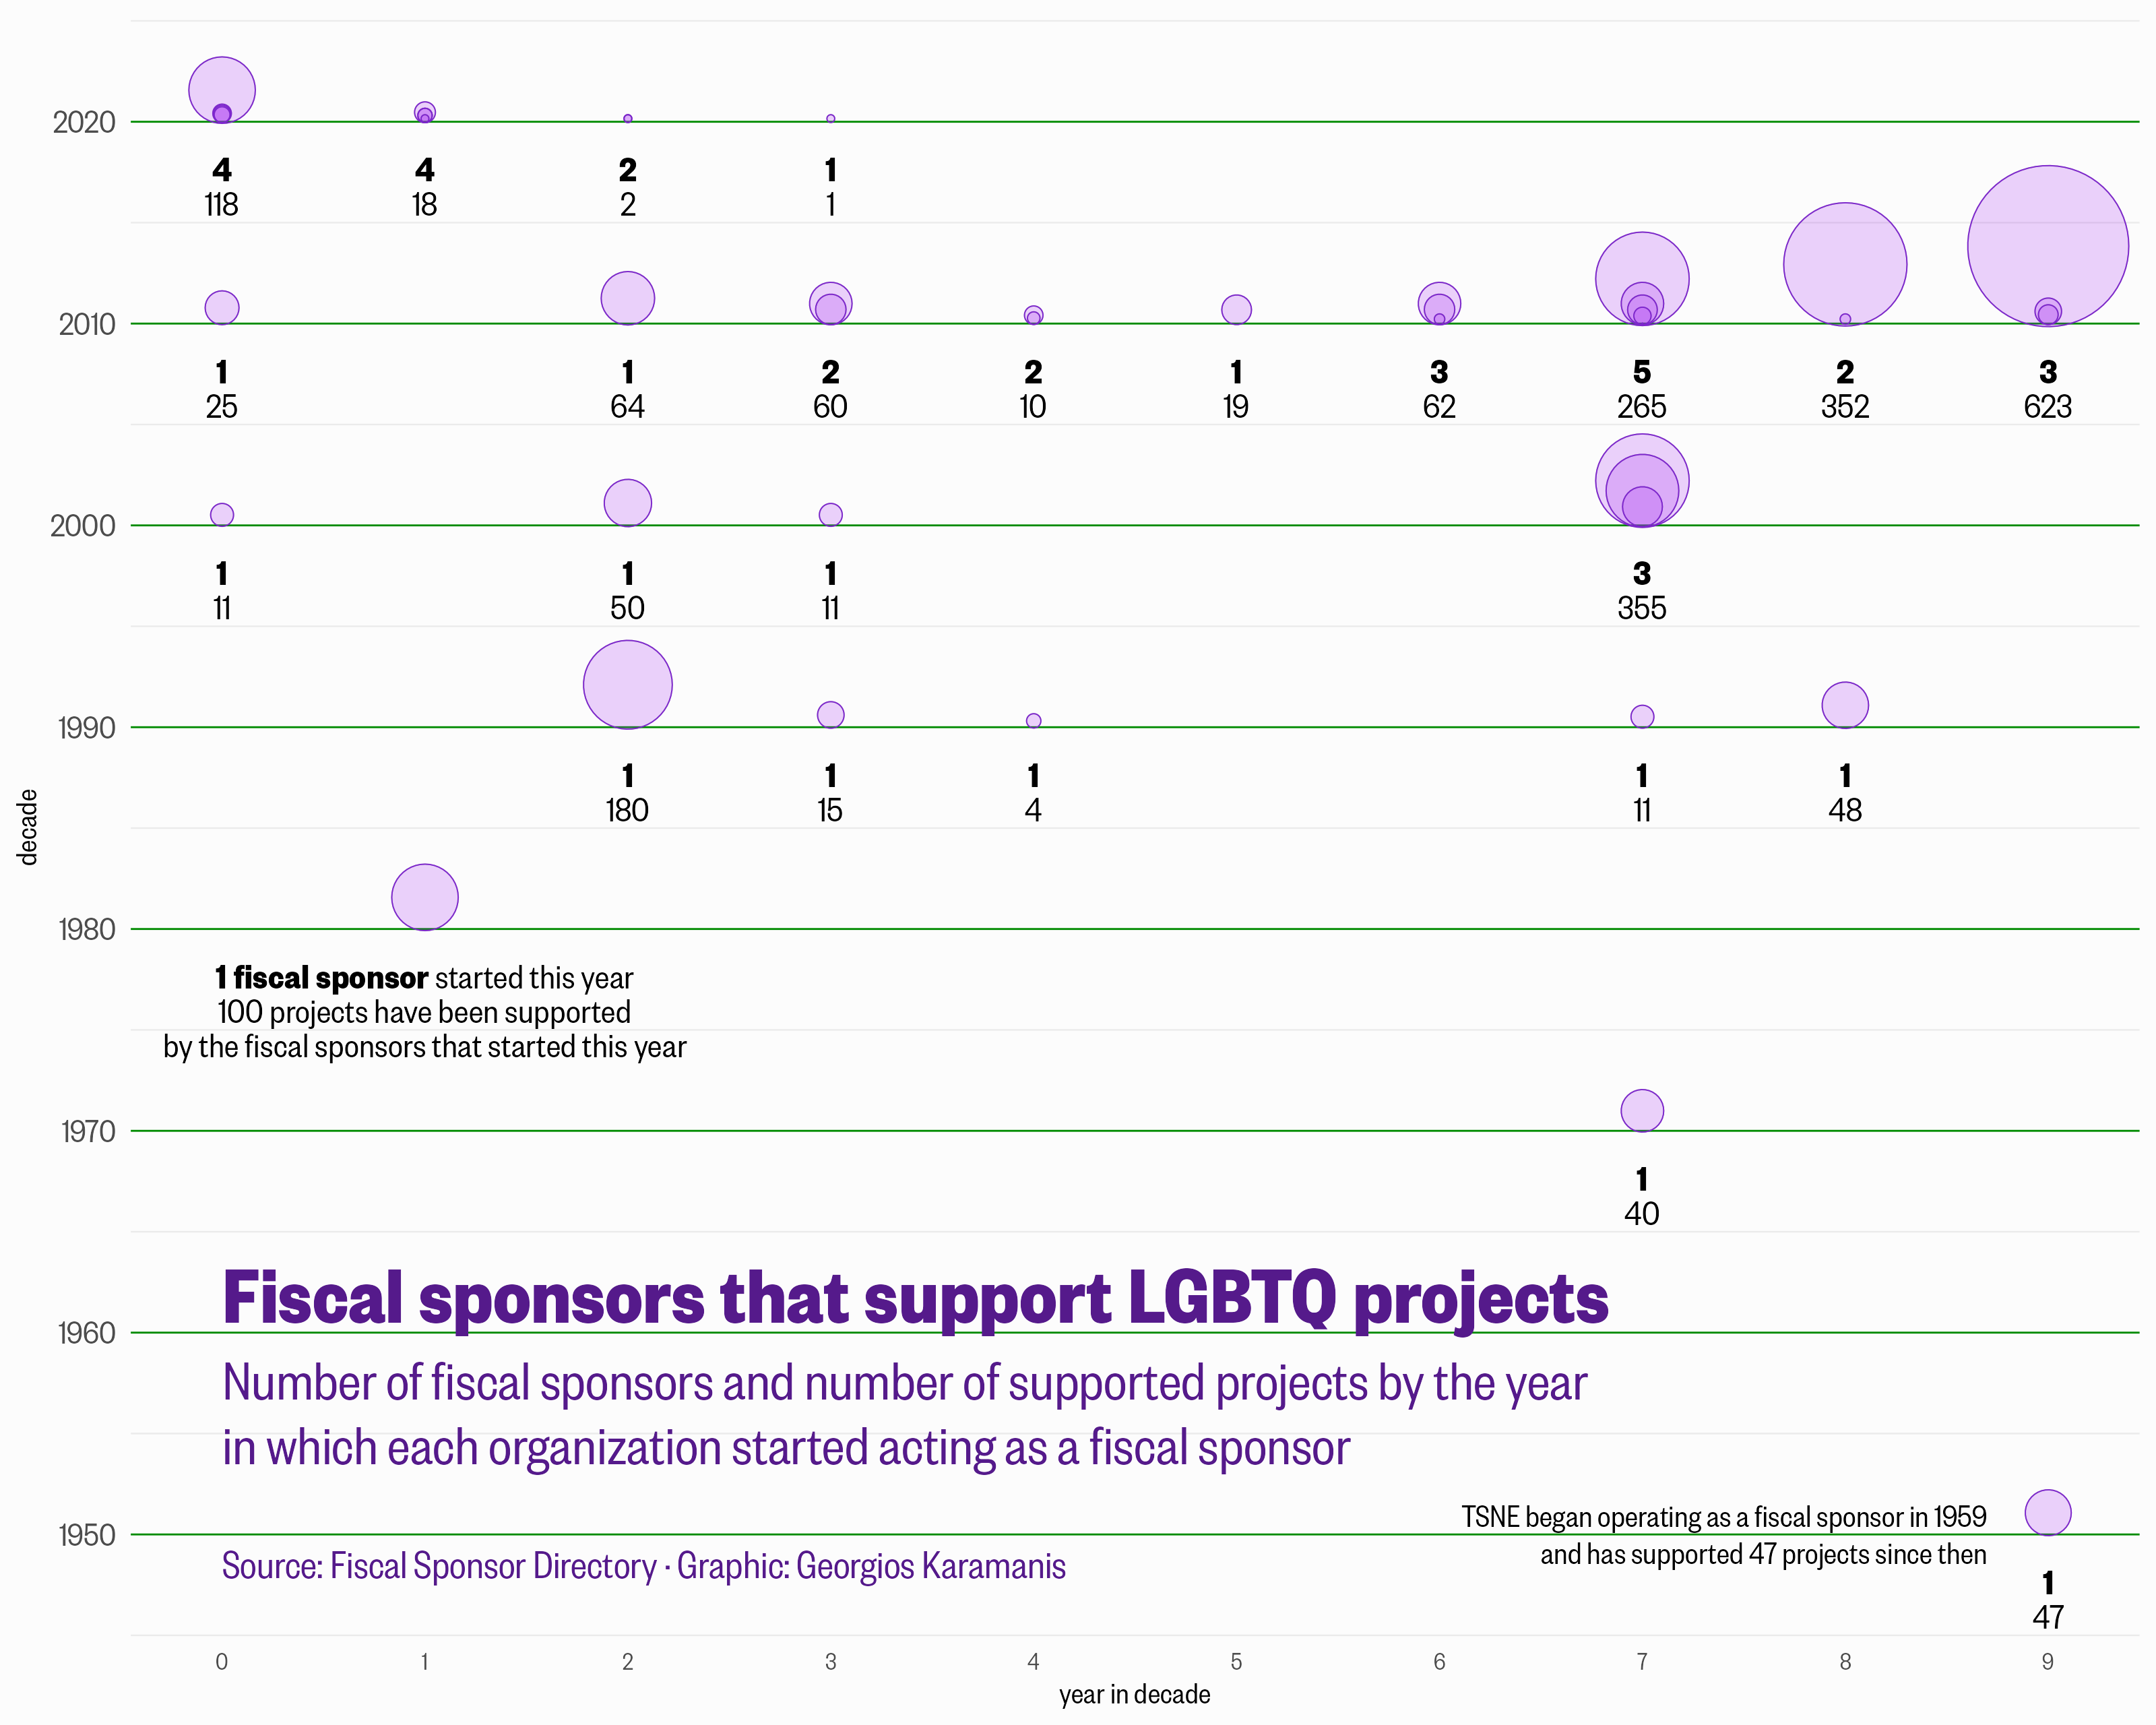
Fiscal sponsors that support LGBTQ projects
bubble
George Karamanis
Mar 15, 2024
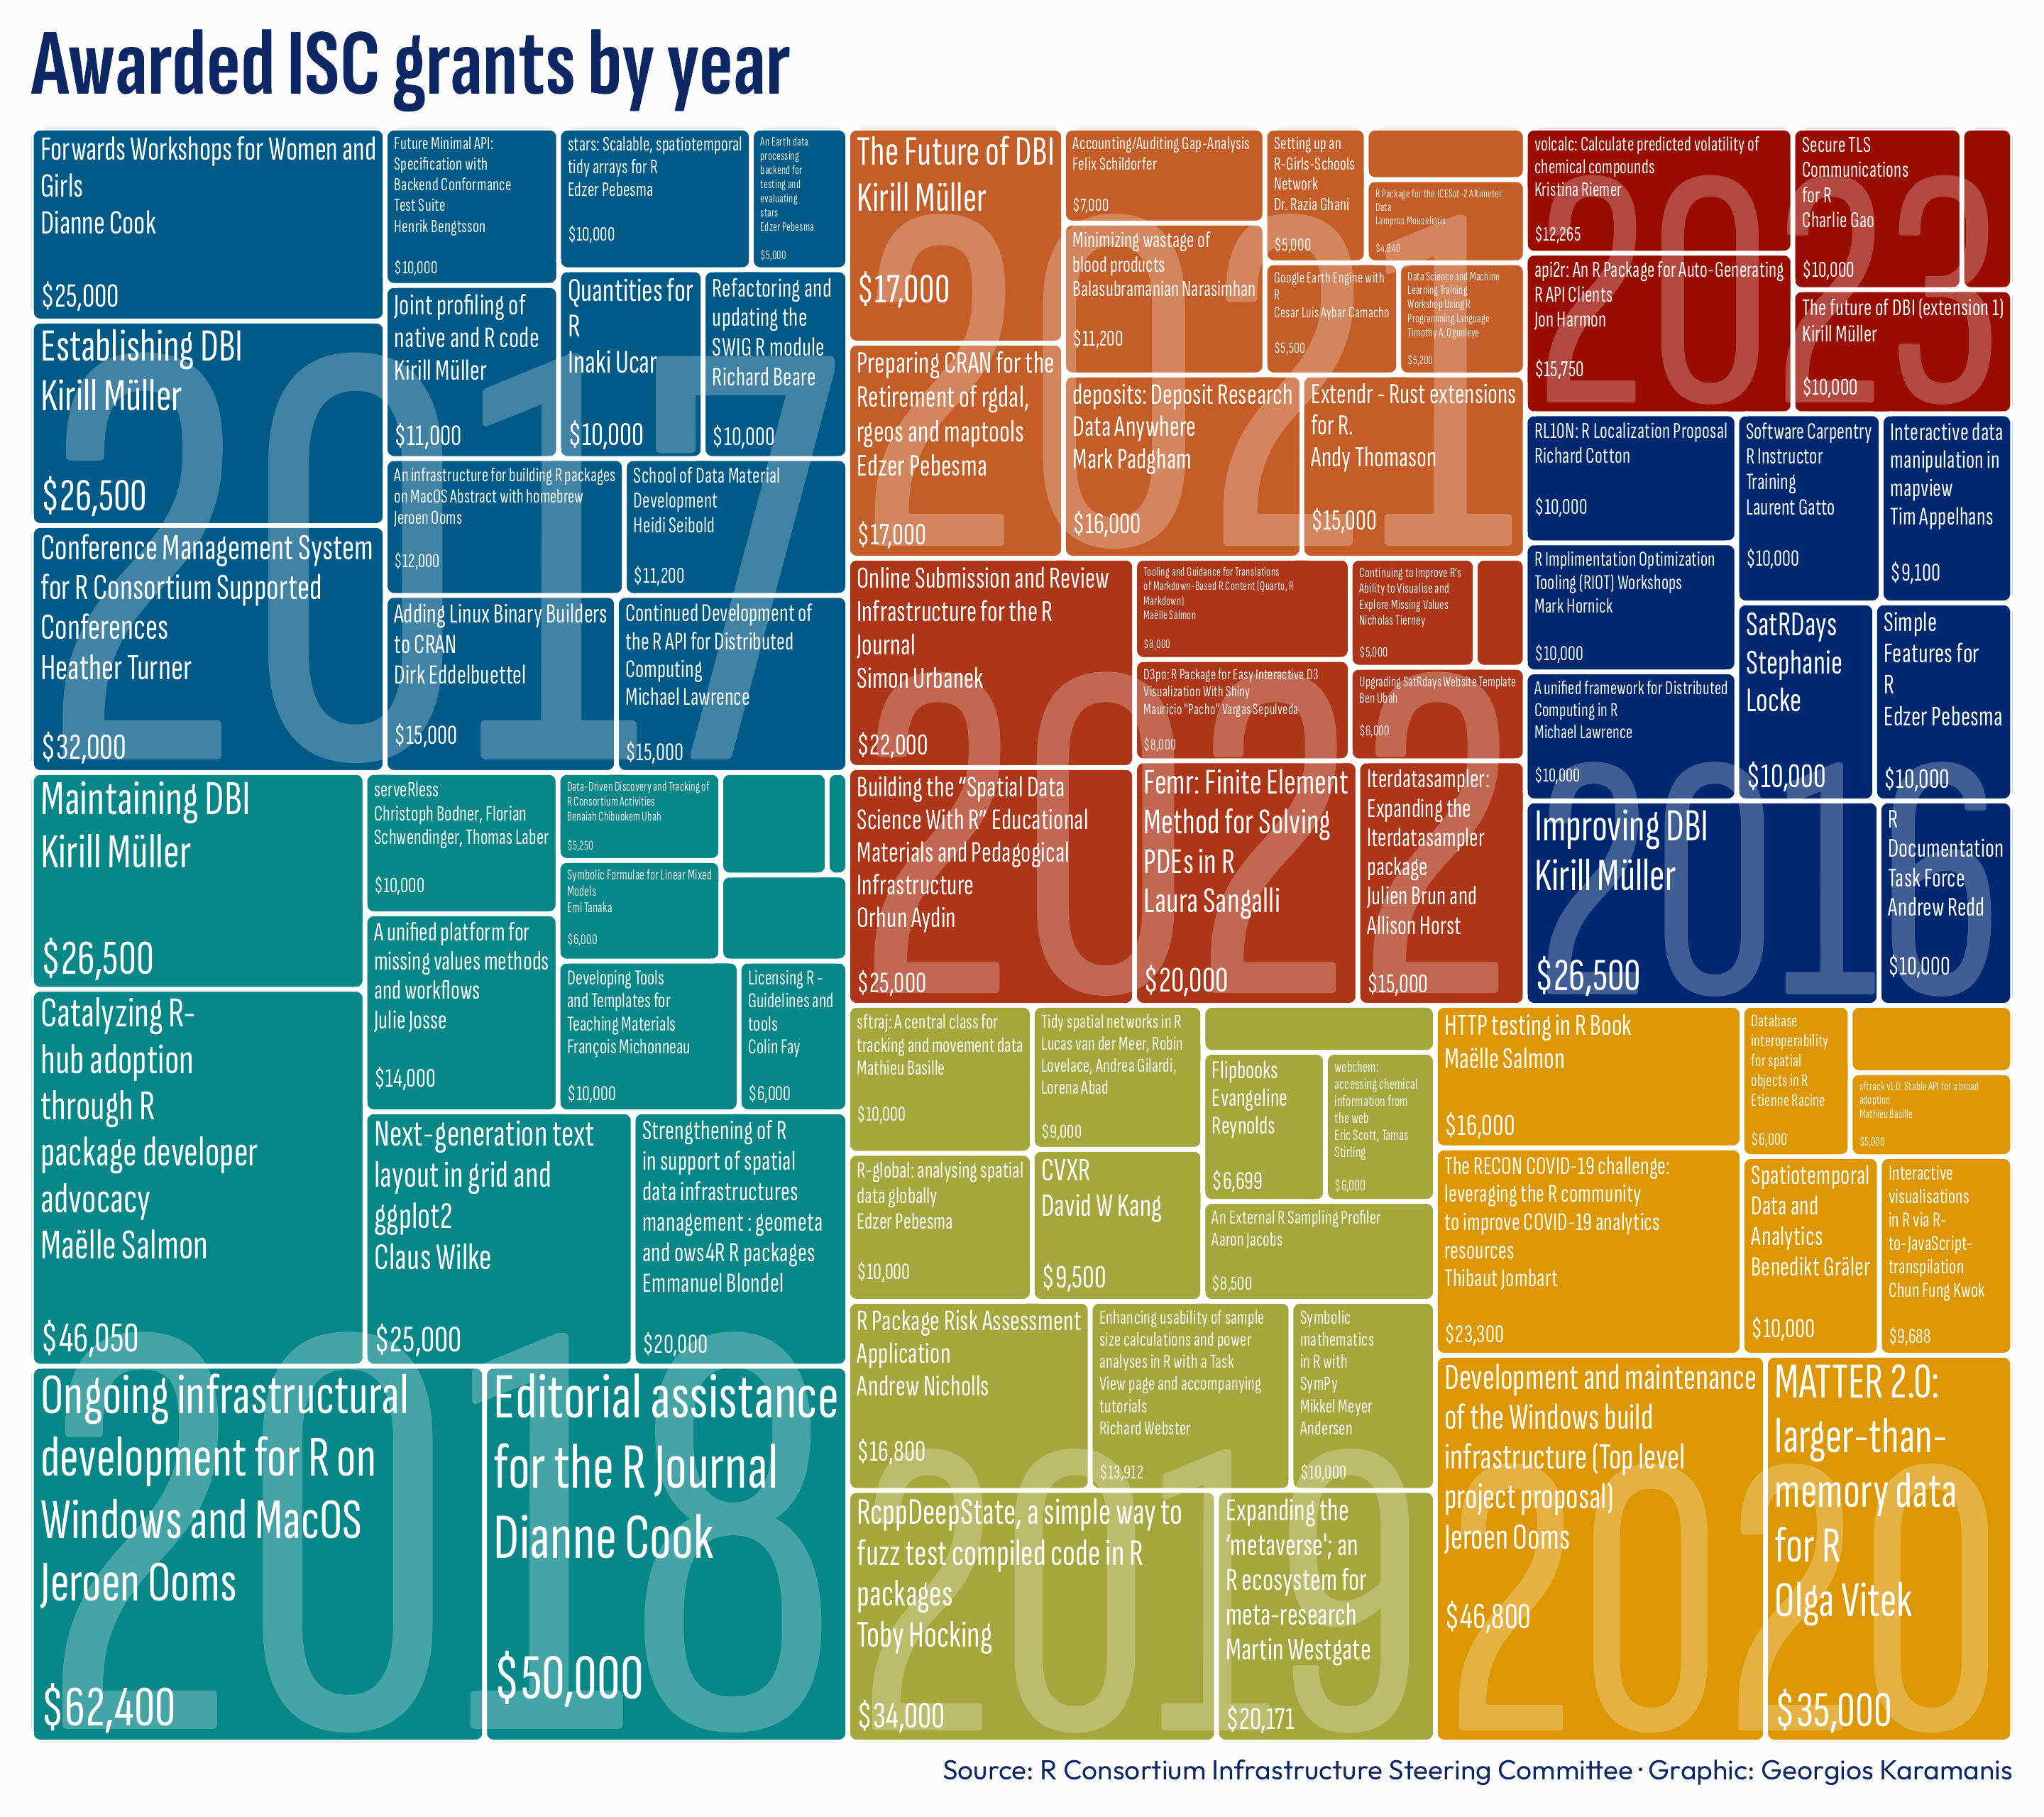
Awarded ISC grants
treemap
George Karamanis
Feb 24, 2024
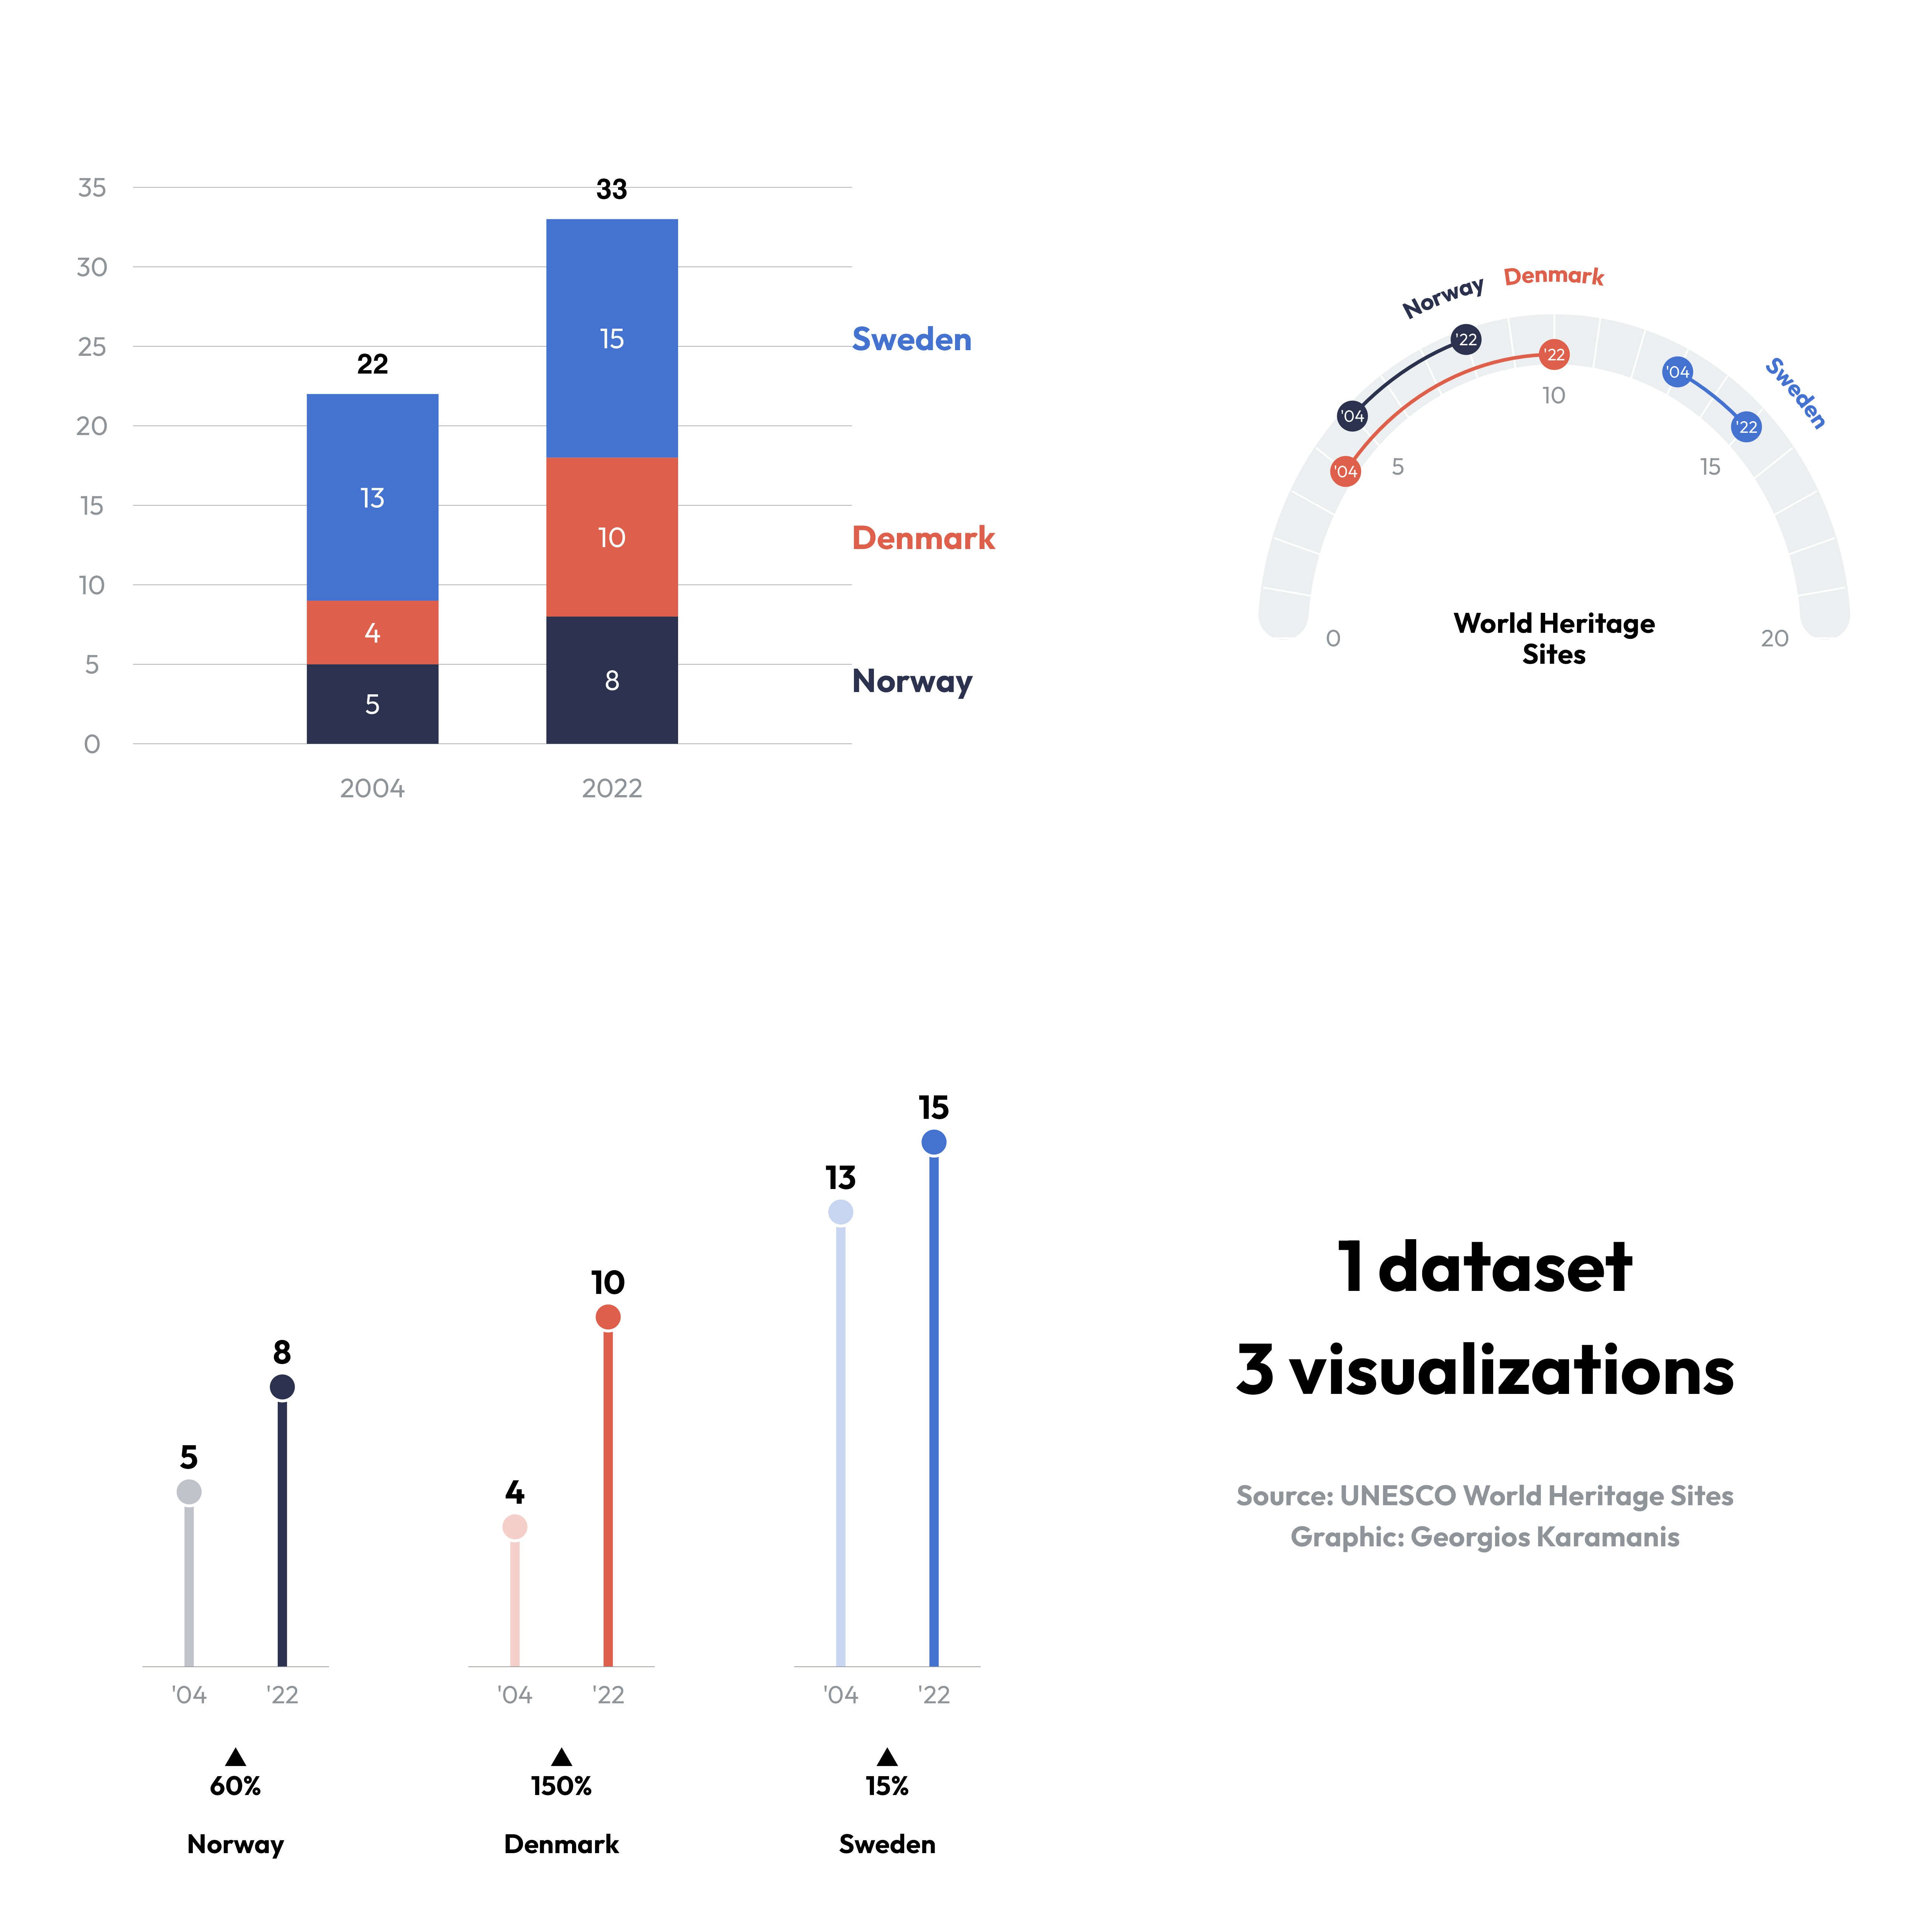
Heritage
bar
lollipop
text at the end of plot
George Karamanis
Feb 11, 2024
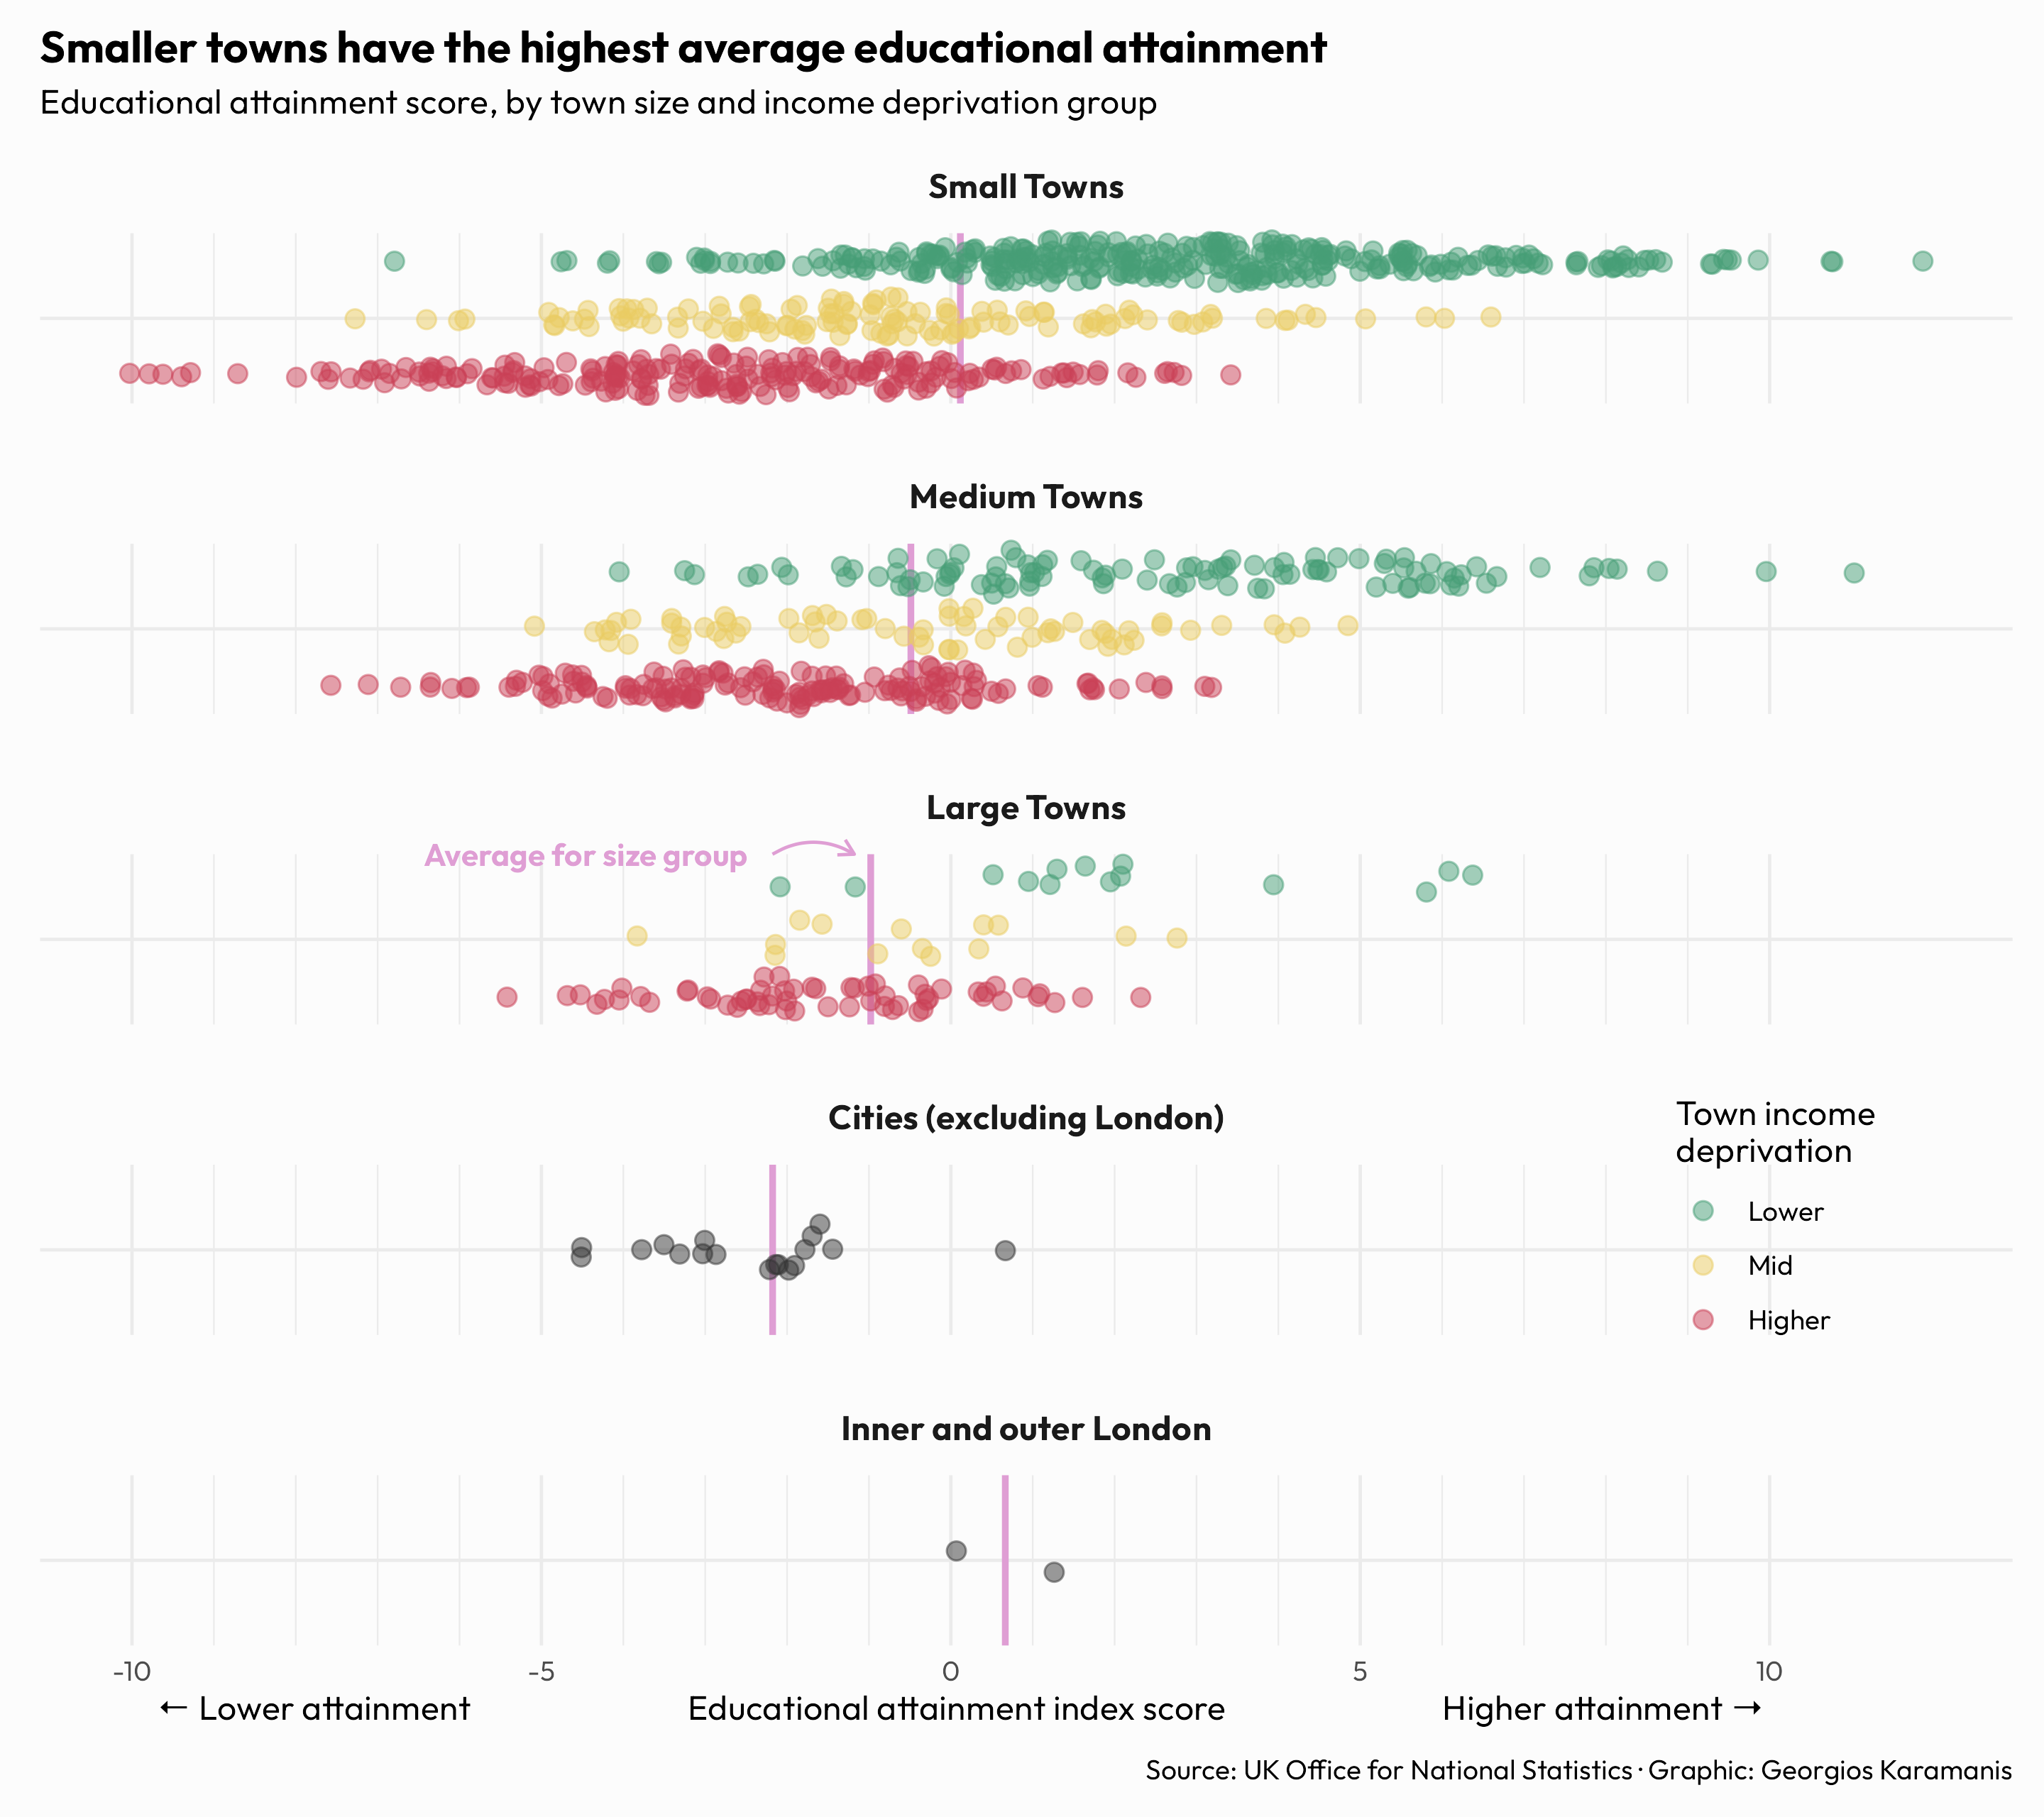
Educational attainment in England
scatter
by group average
George Karamanis
Jan 28, 2024
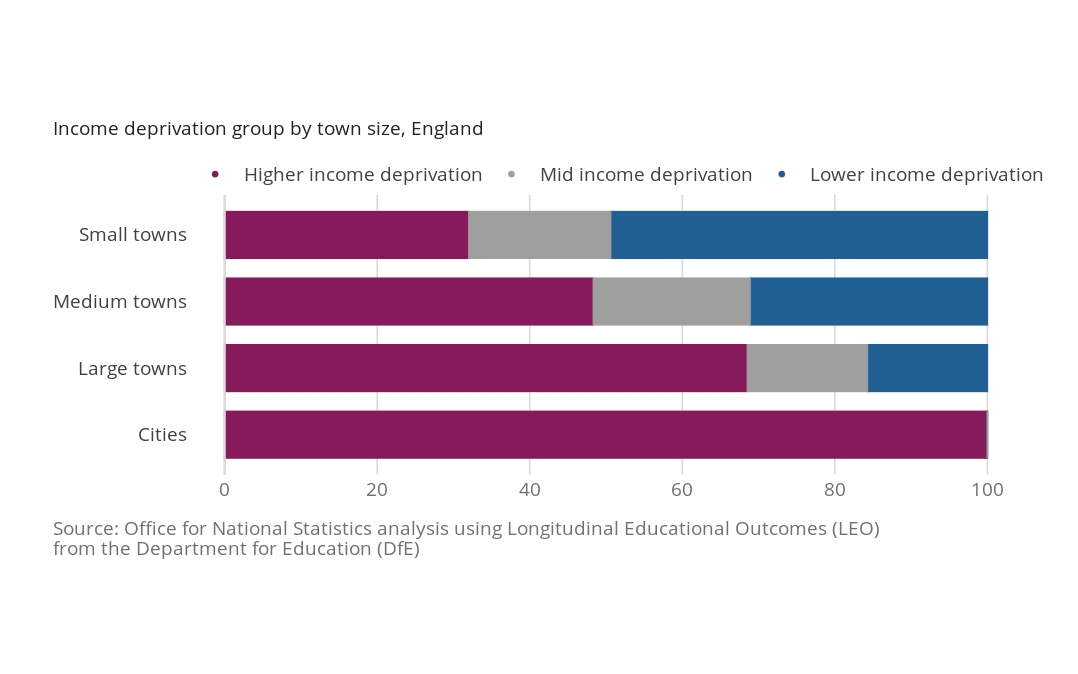
English education
bar
stacked
only colour
legend
Srishti Putcha
Jan 23, 2024
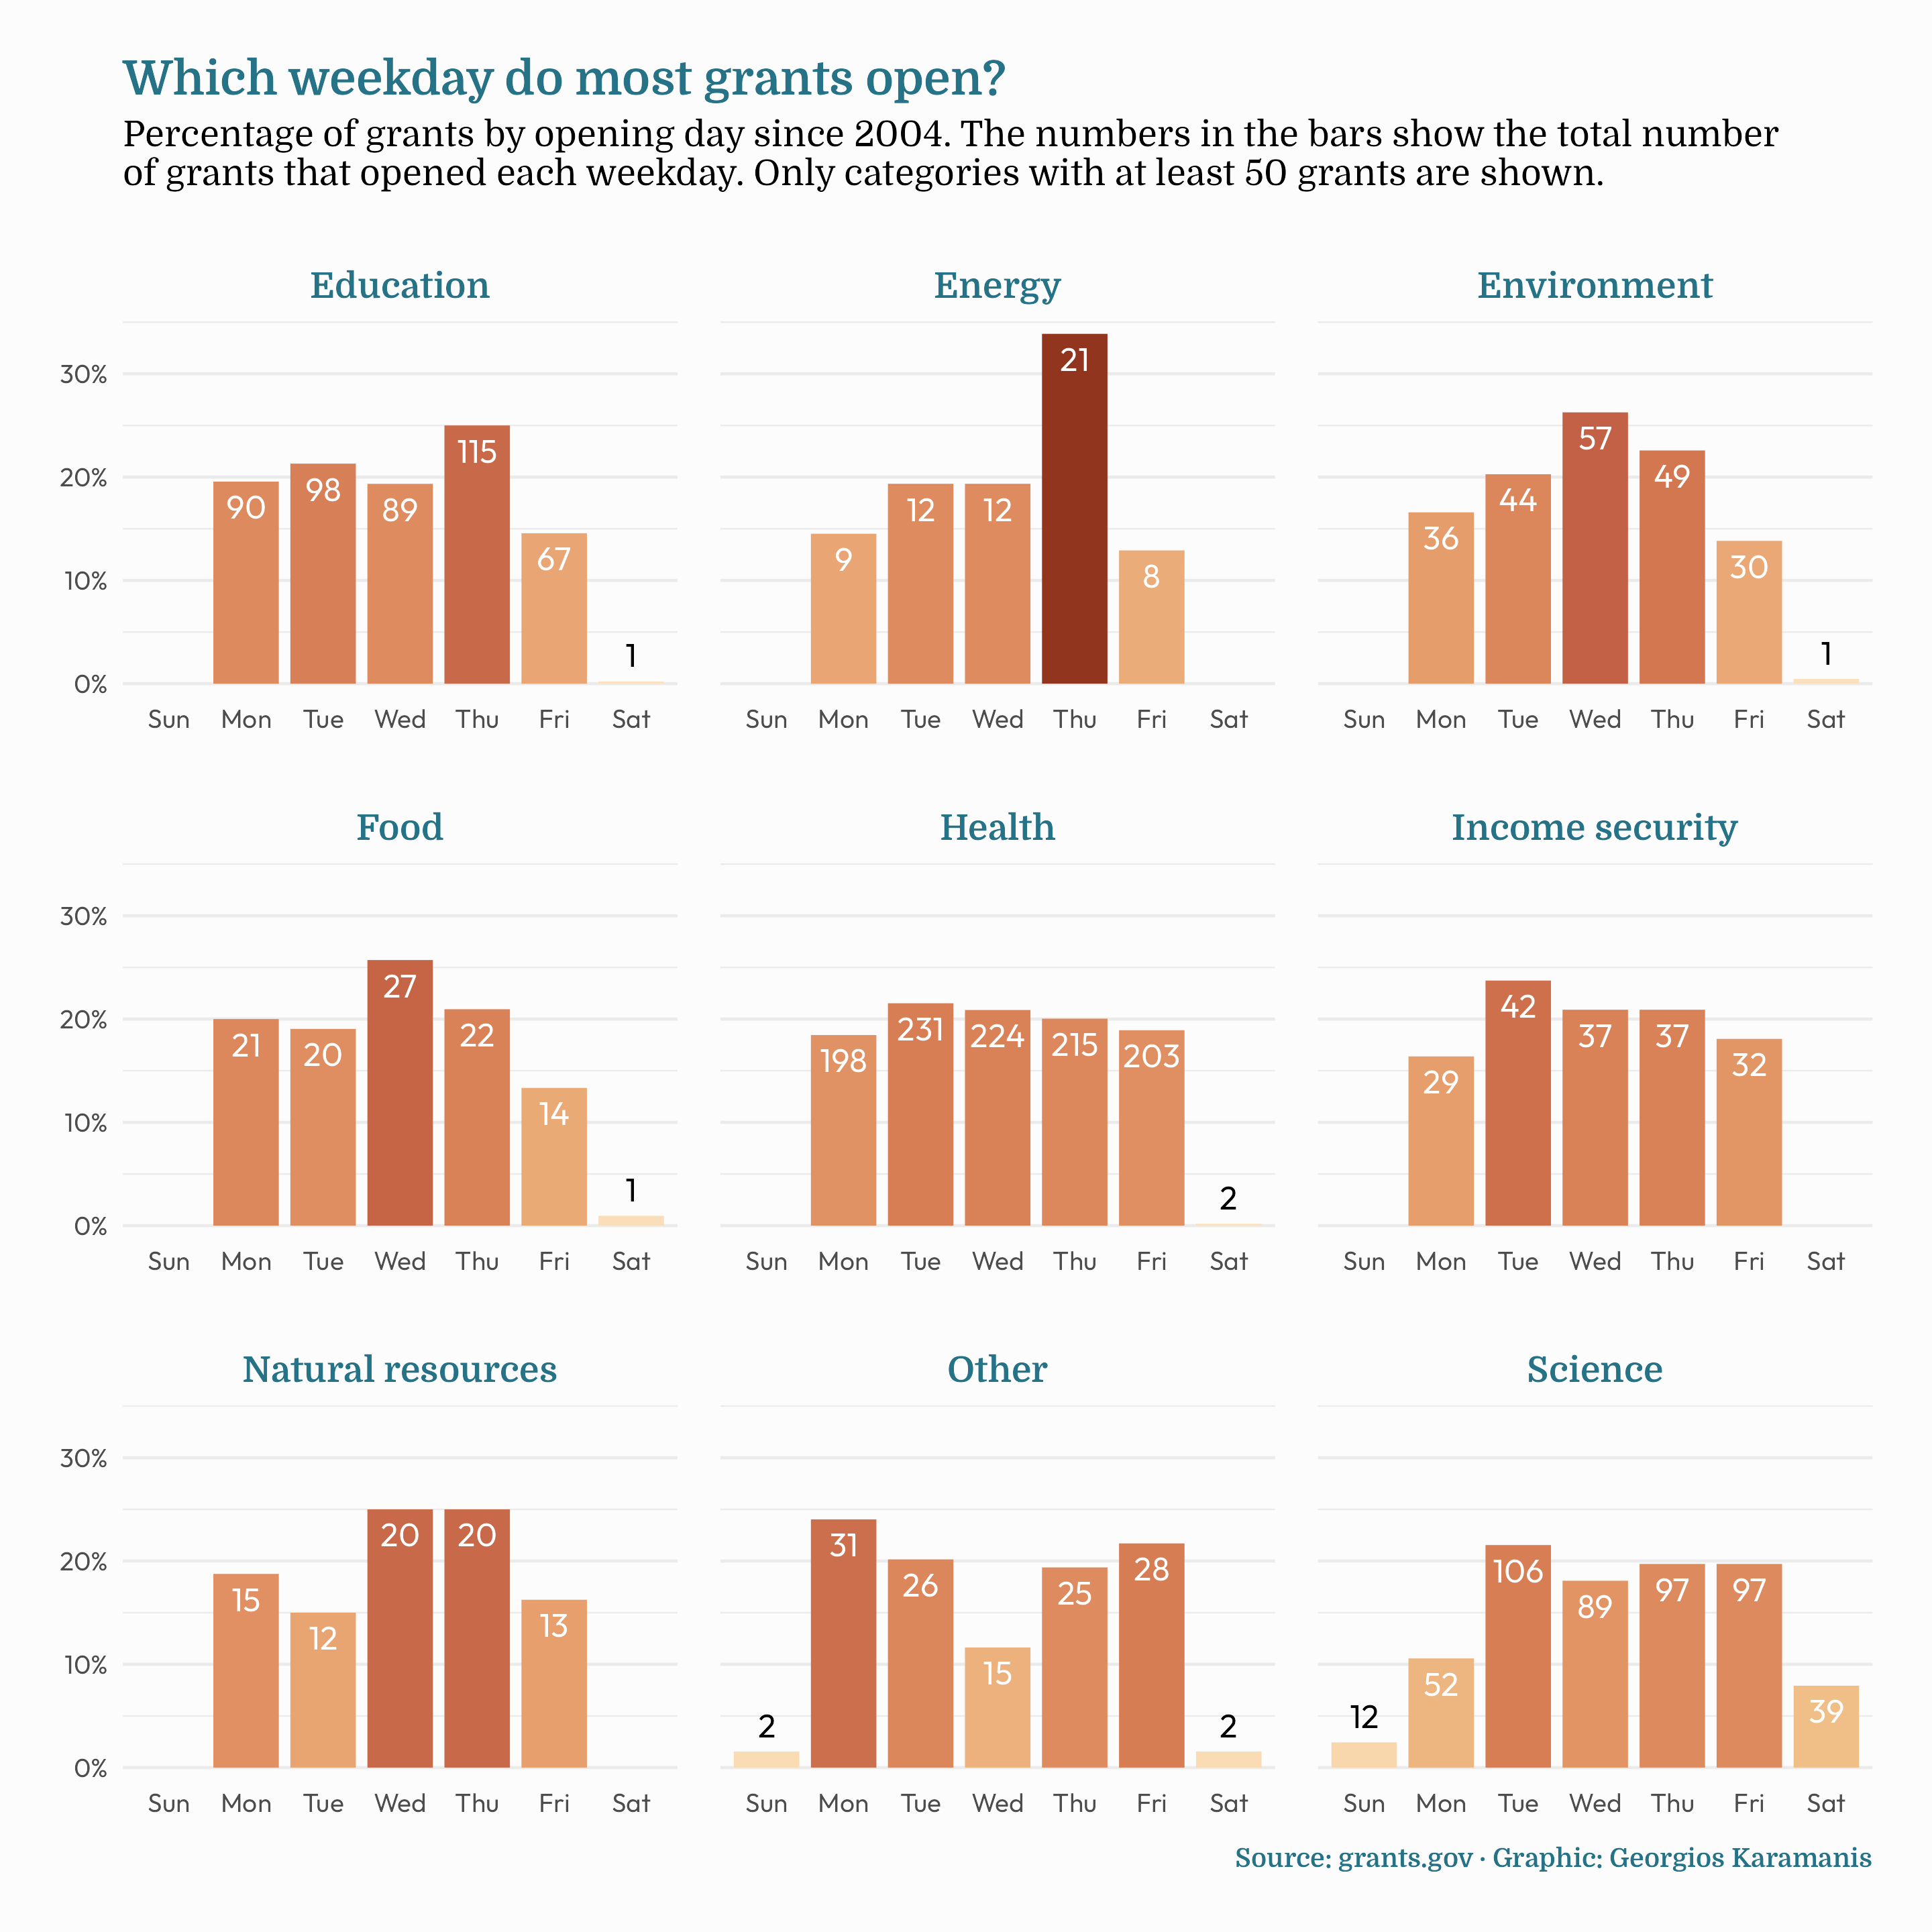
Weekday grants opening
bar
alpha color
George Karamanis
Oct 8, 2023
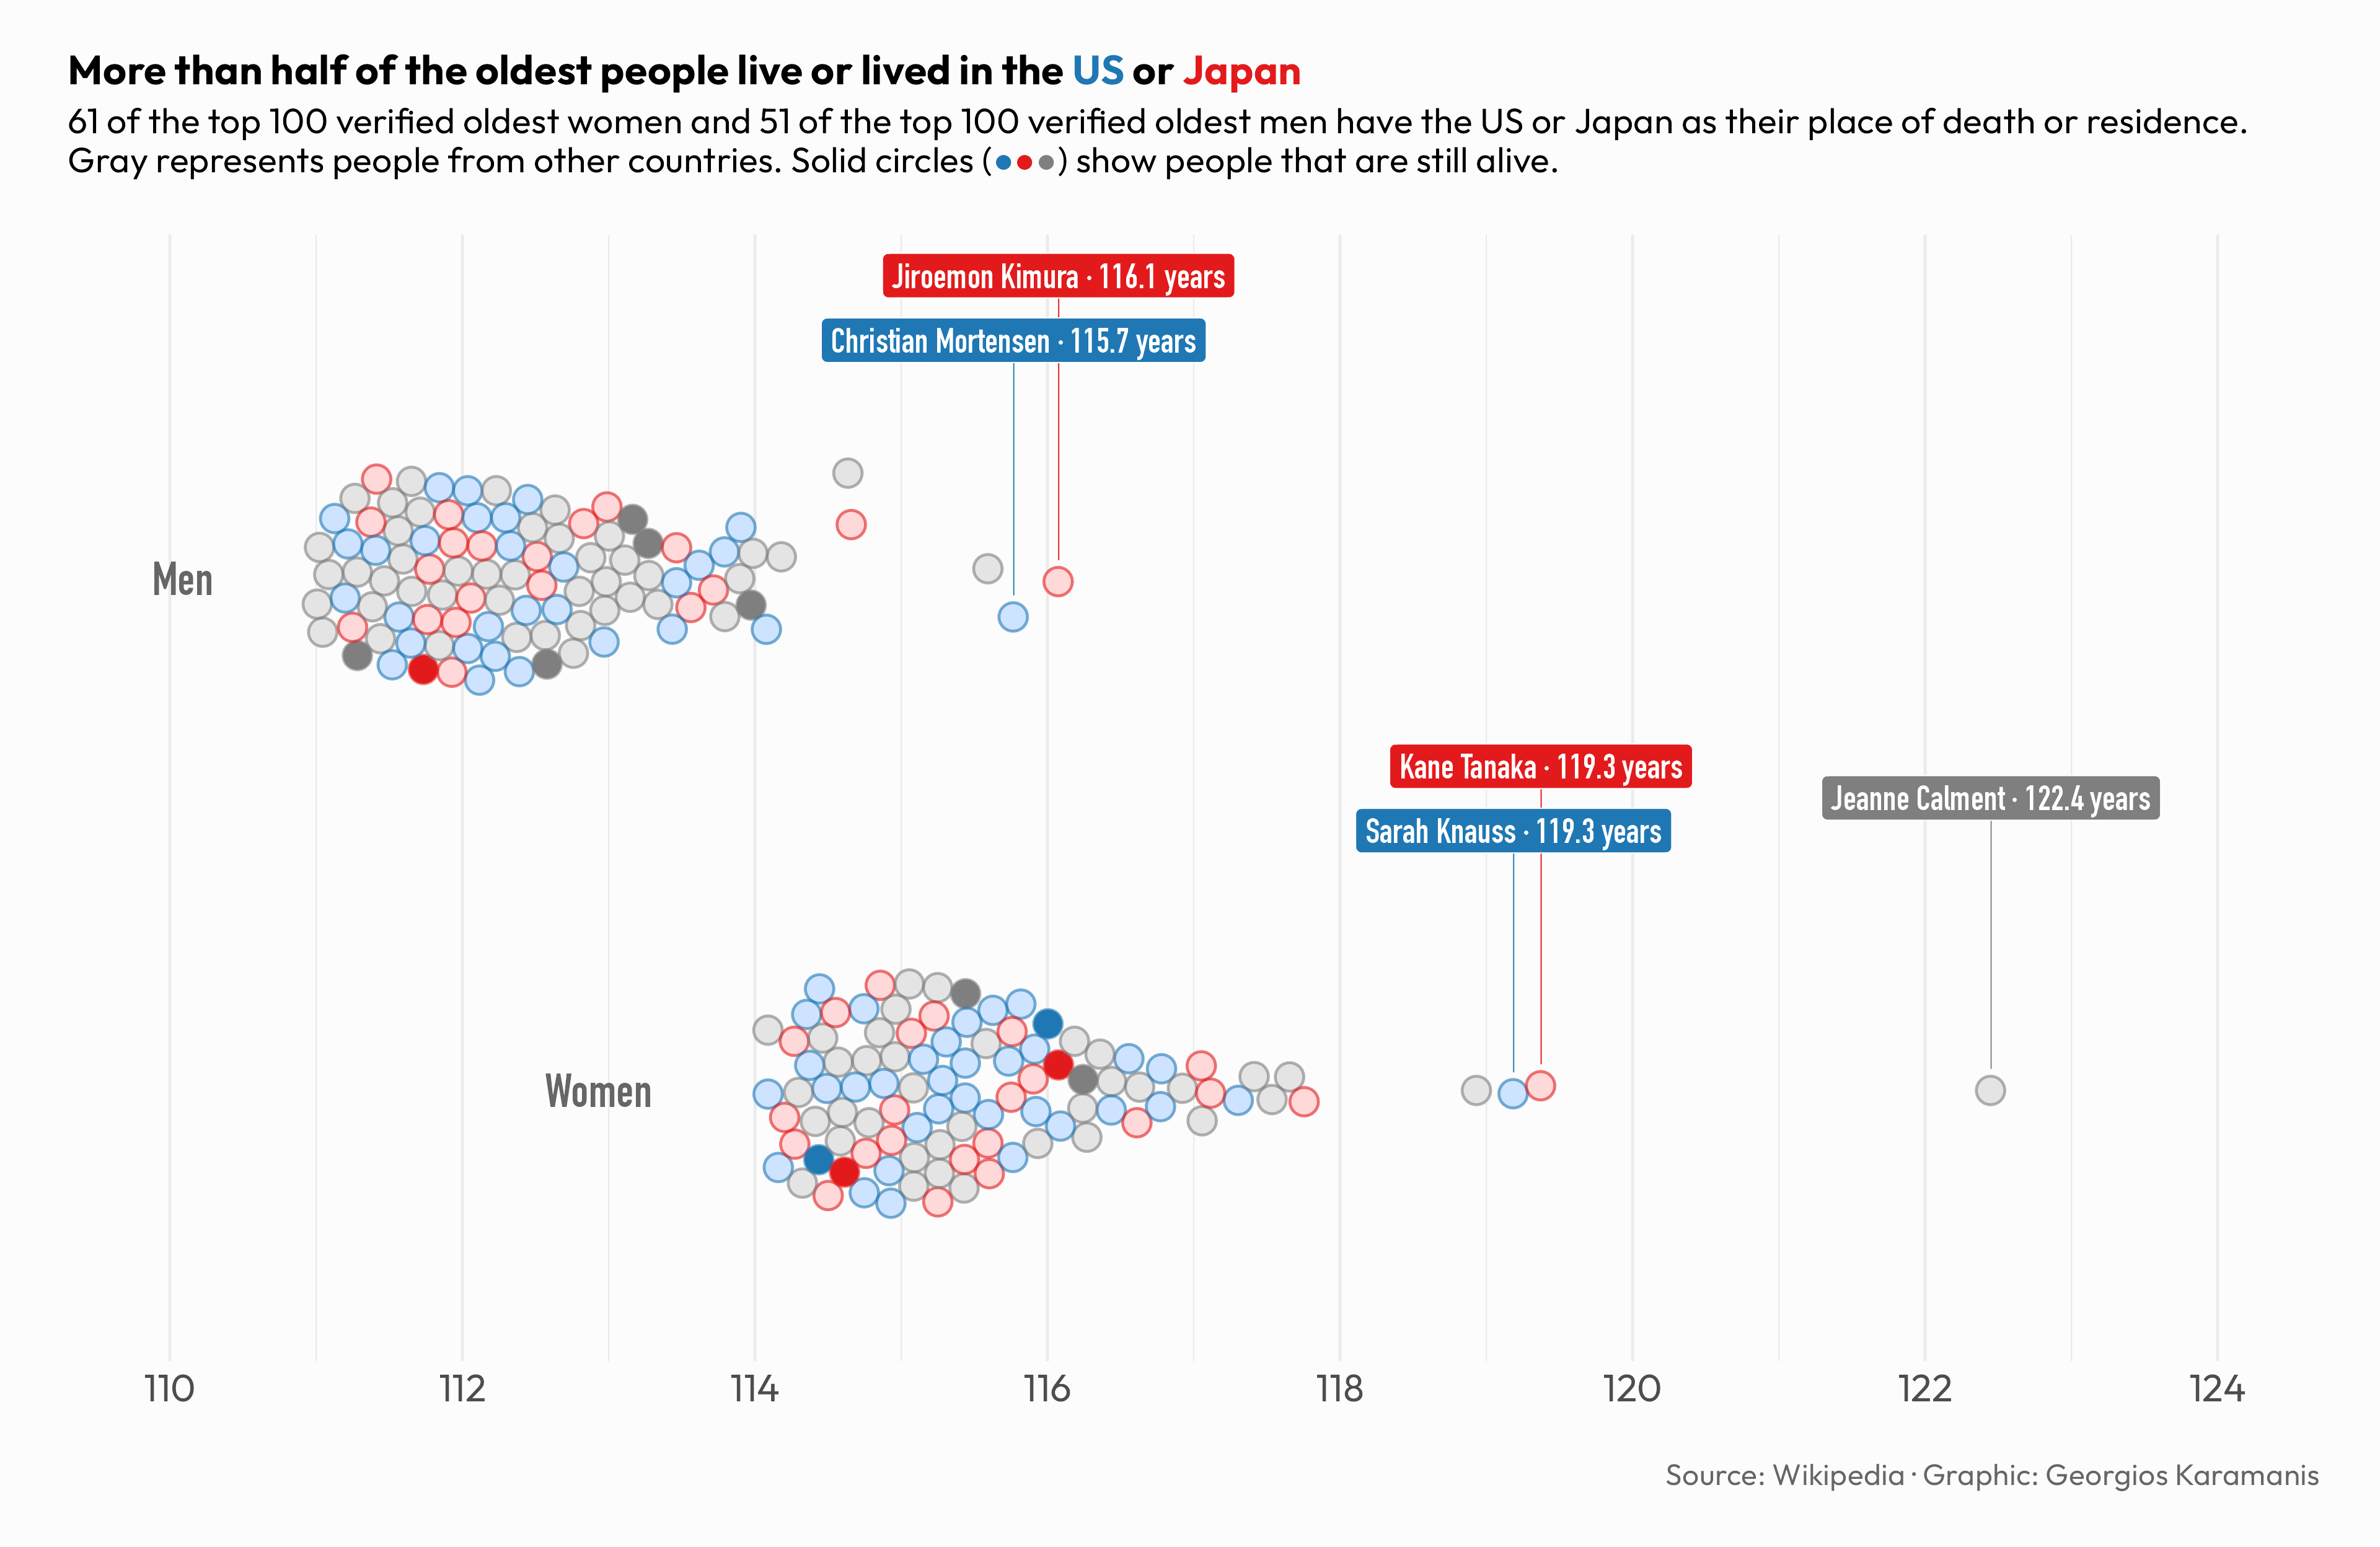
Centenarians
scatter
outliers text
George Karamanis
Oct 8, 2023
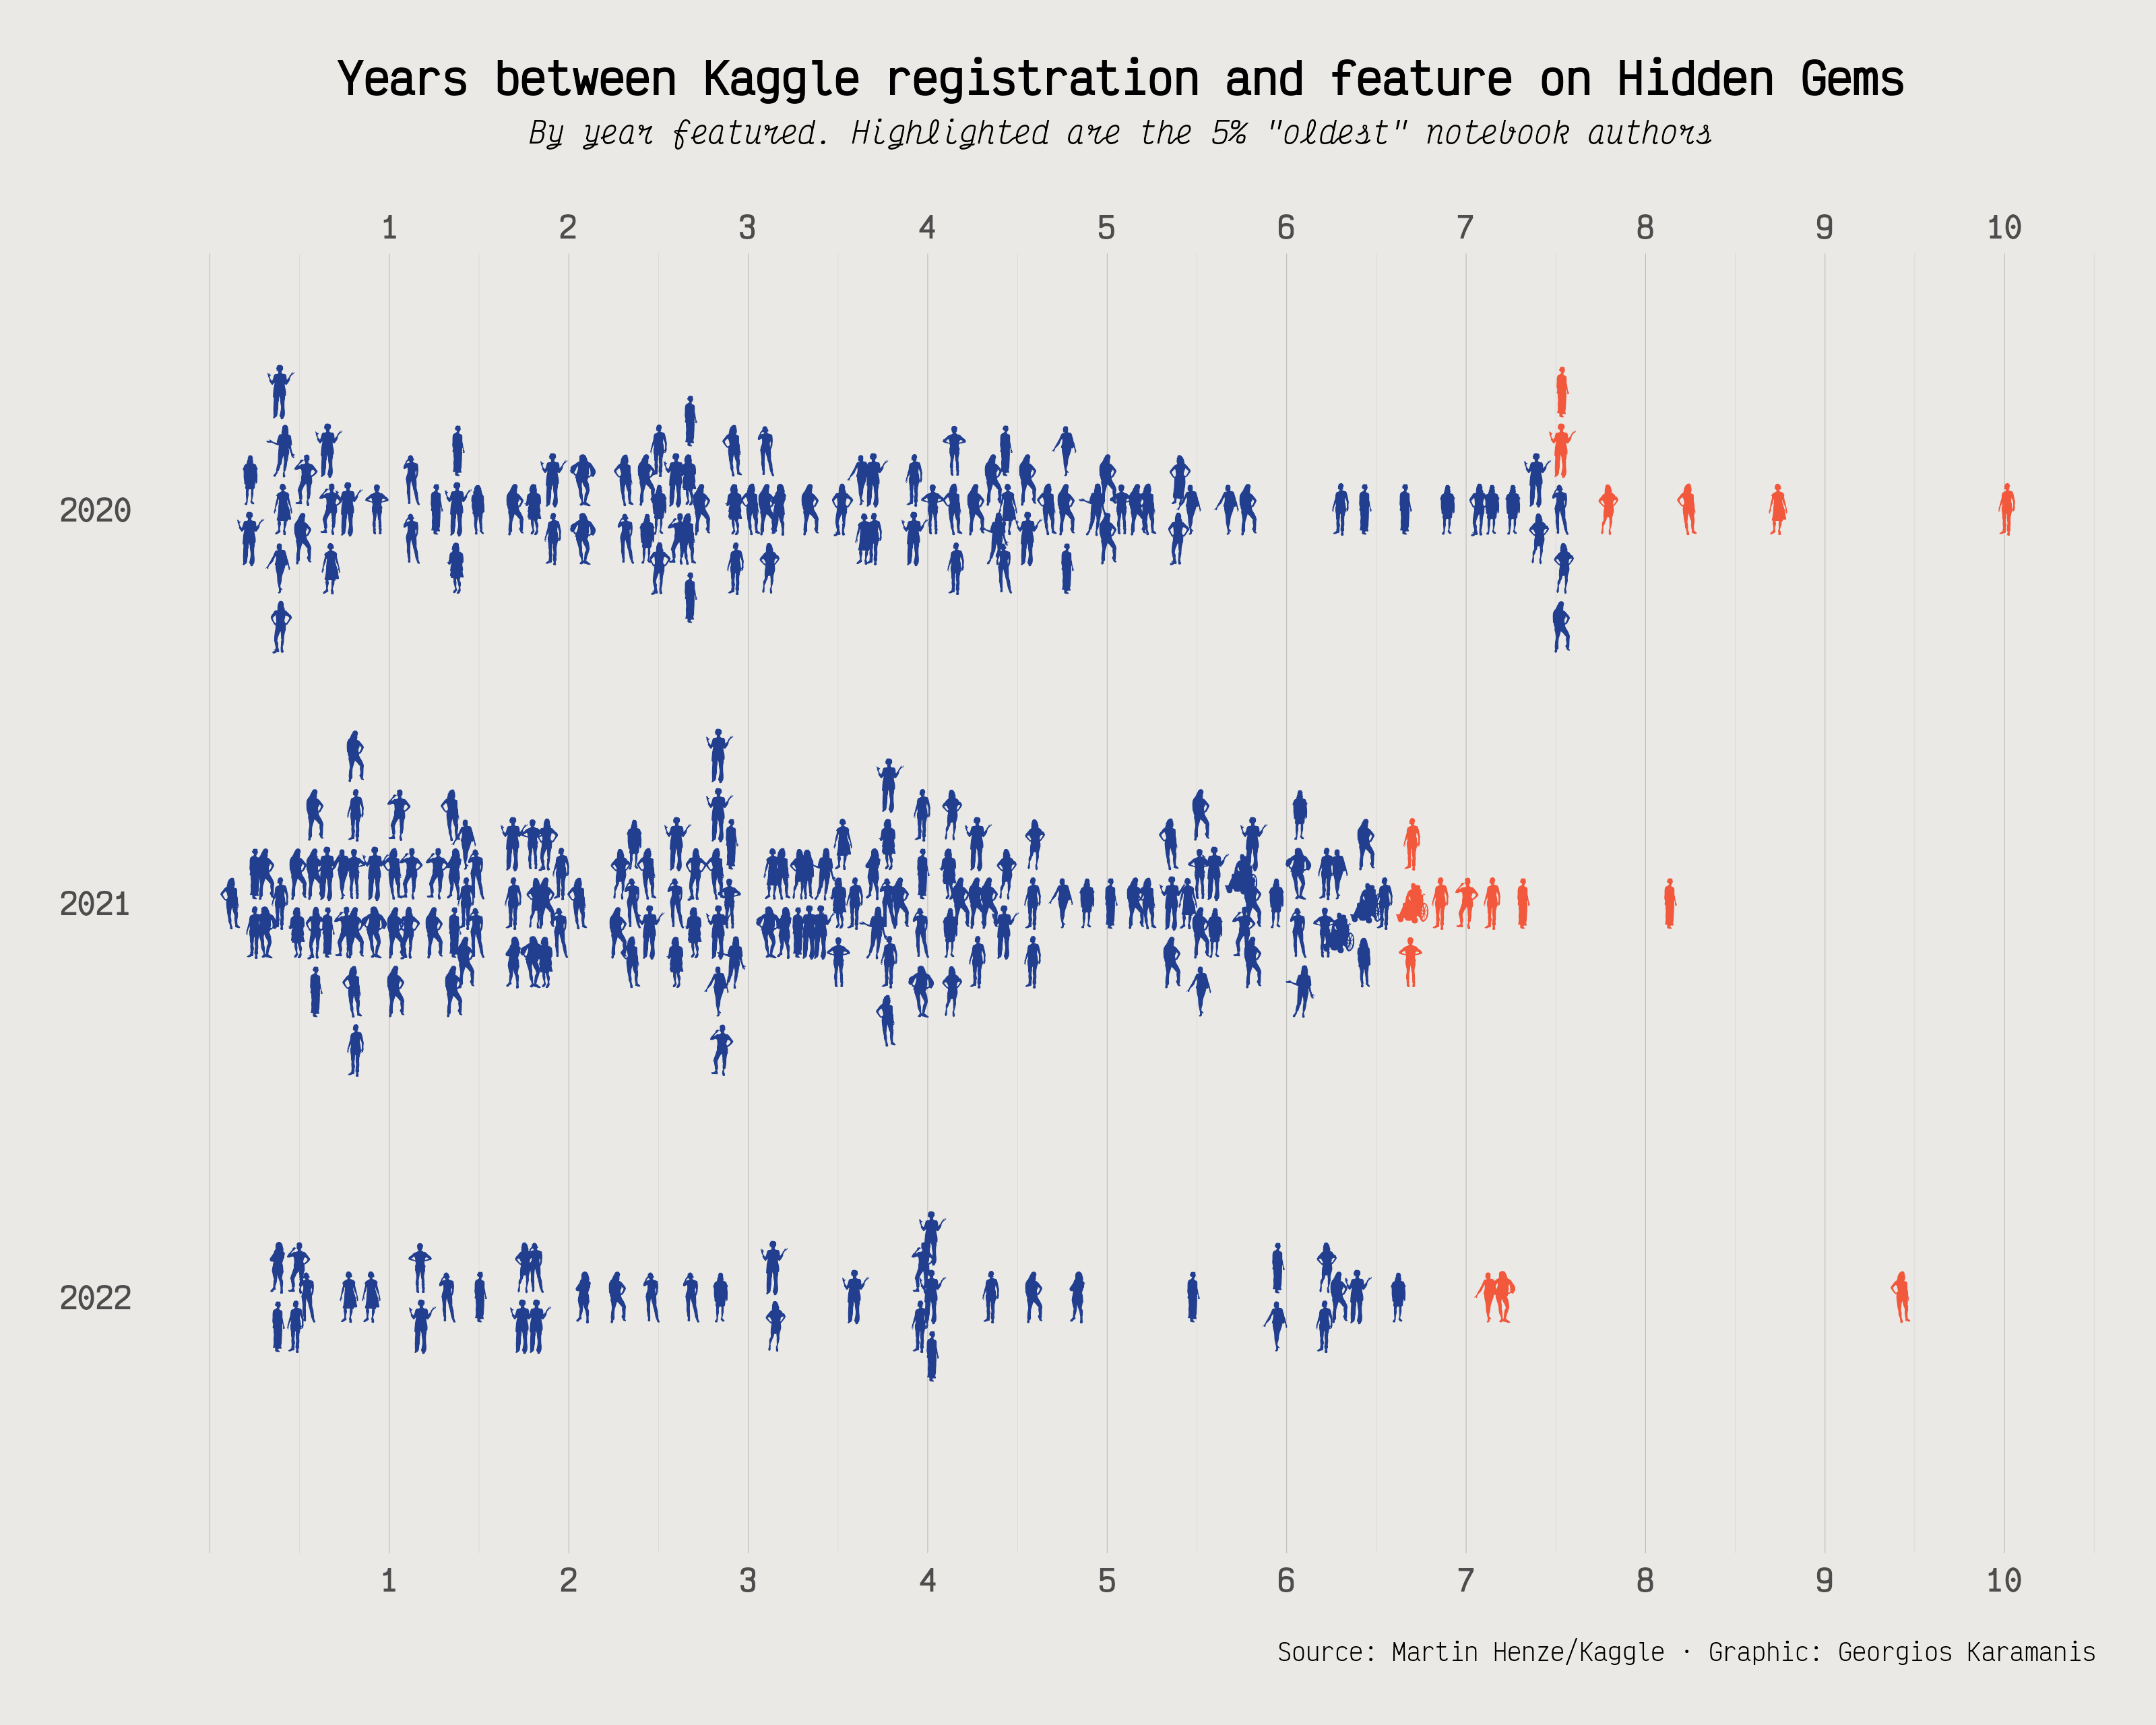
Hidden Gems
scatter
icons
George Karamanis
Oct 8, 2023
US Grants
scatter
text
labels
Nick Pechlivanis
Oct 3, 2023
Time spent
treemap
coloured text
Nicola Rennie
Sep 12, 2023
Plot wages by demographics and occupation
line
Nick Pechlivanis
Sep 5, 2023
IQR measures idea
points
mean
min
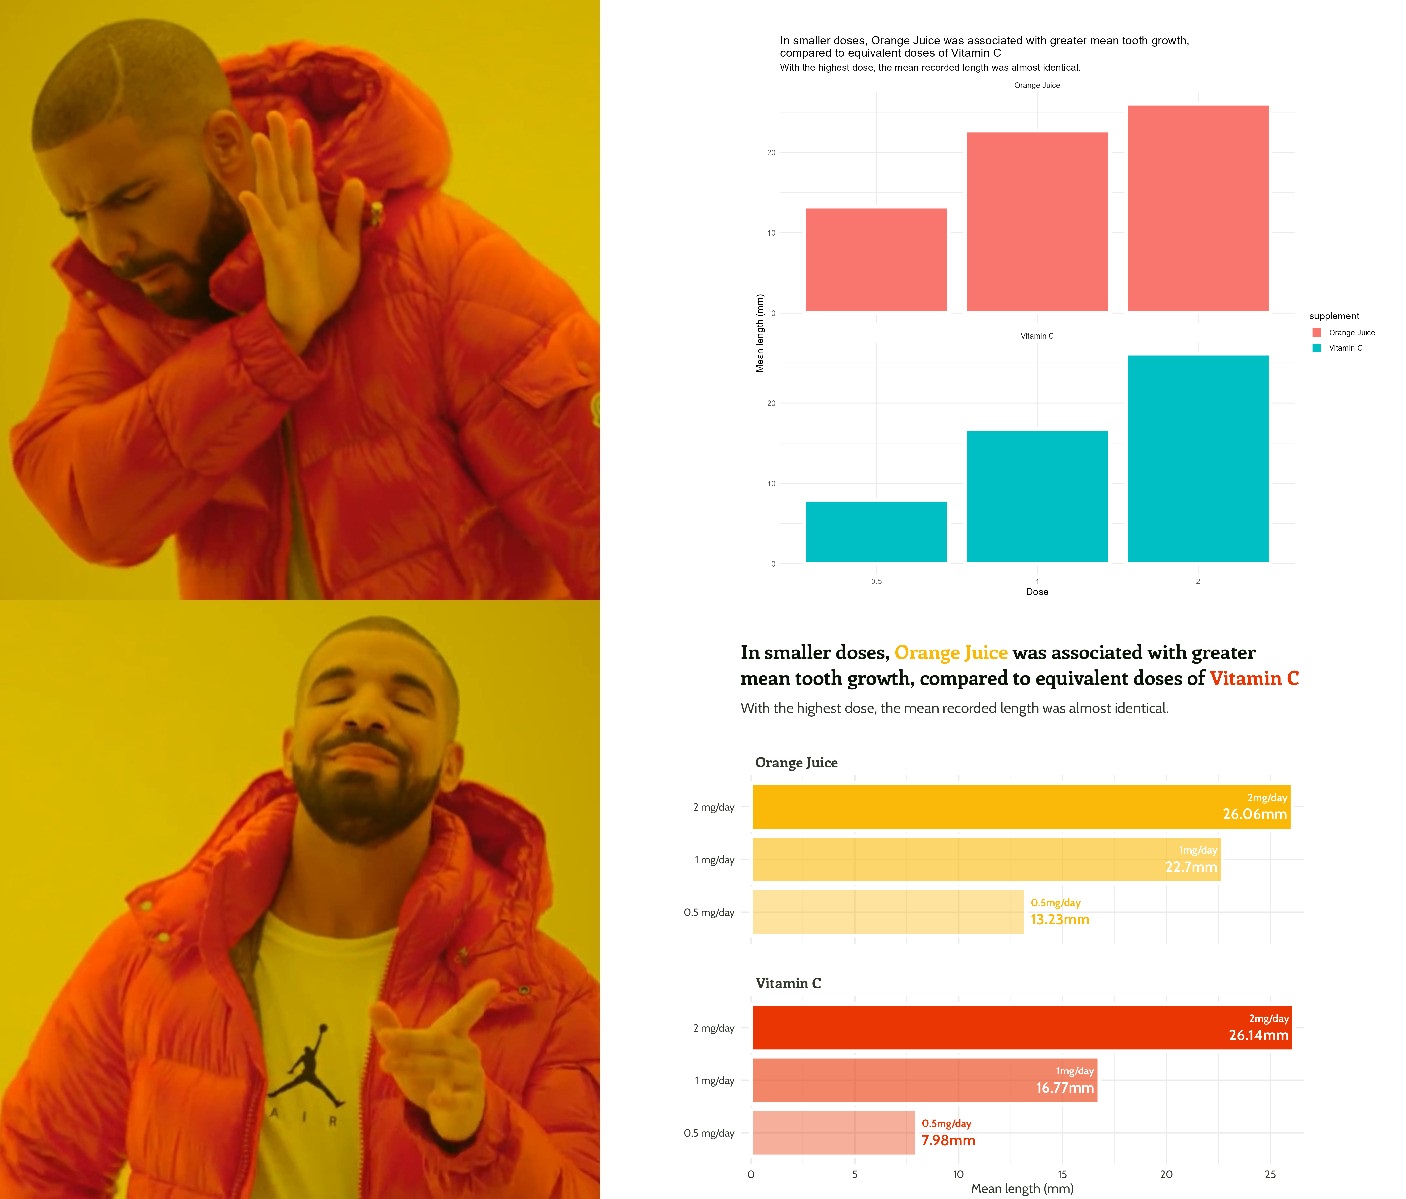
Nick Pechlivanis
May 2, 2023
bars with colours and text
bar
text
colour
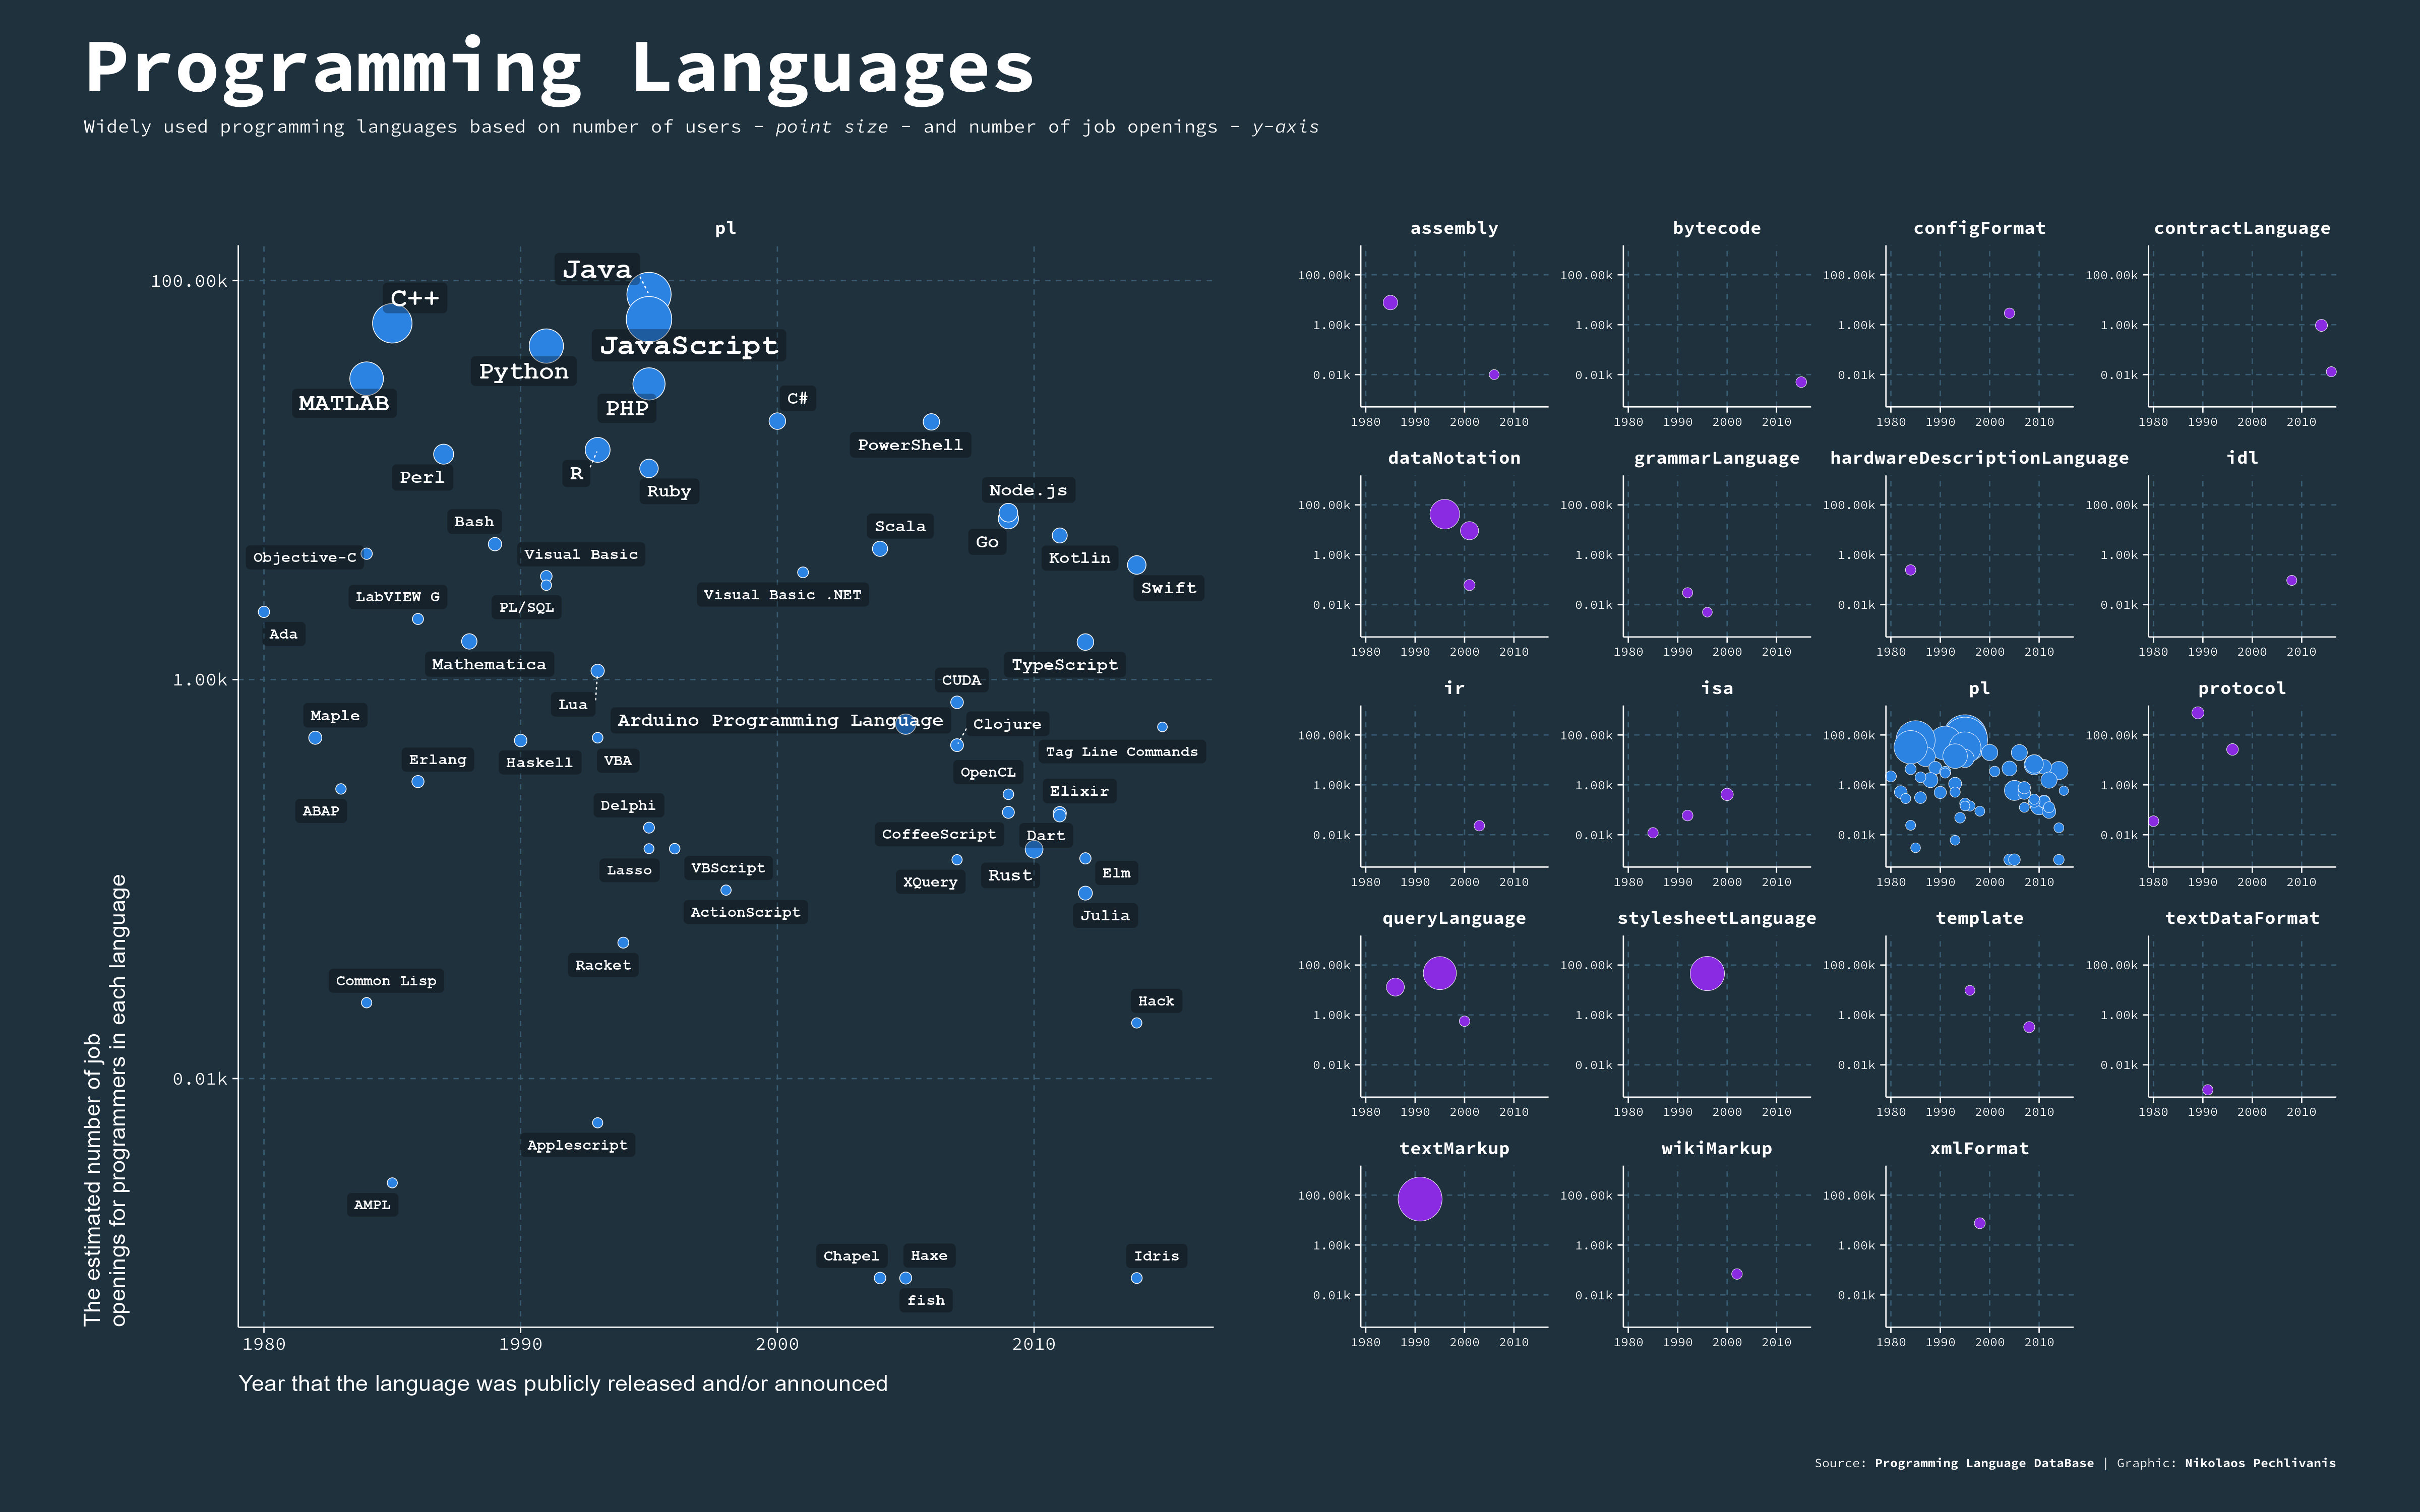
Cara Thompson
Apr 20, 2023
Programming Languages
scatter
bubbles
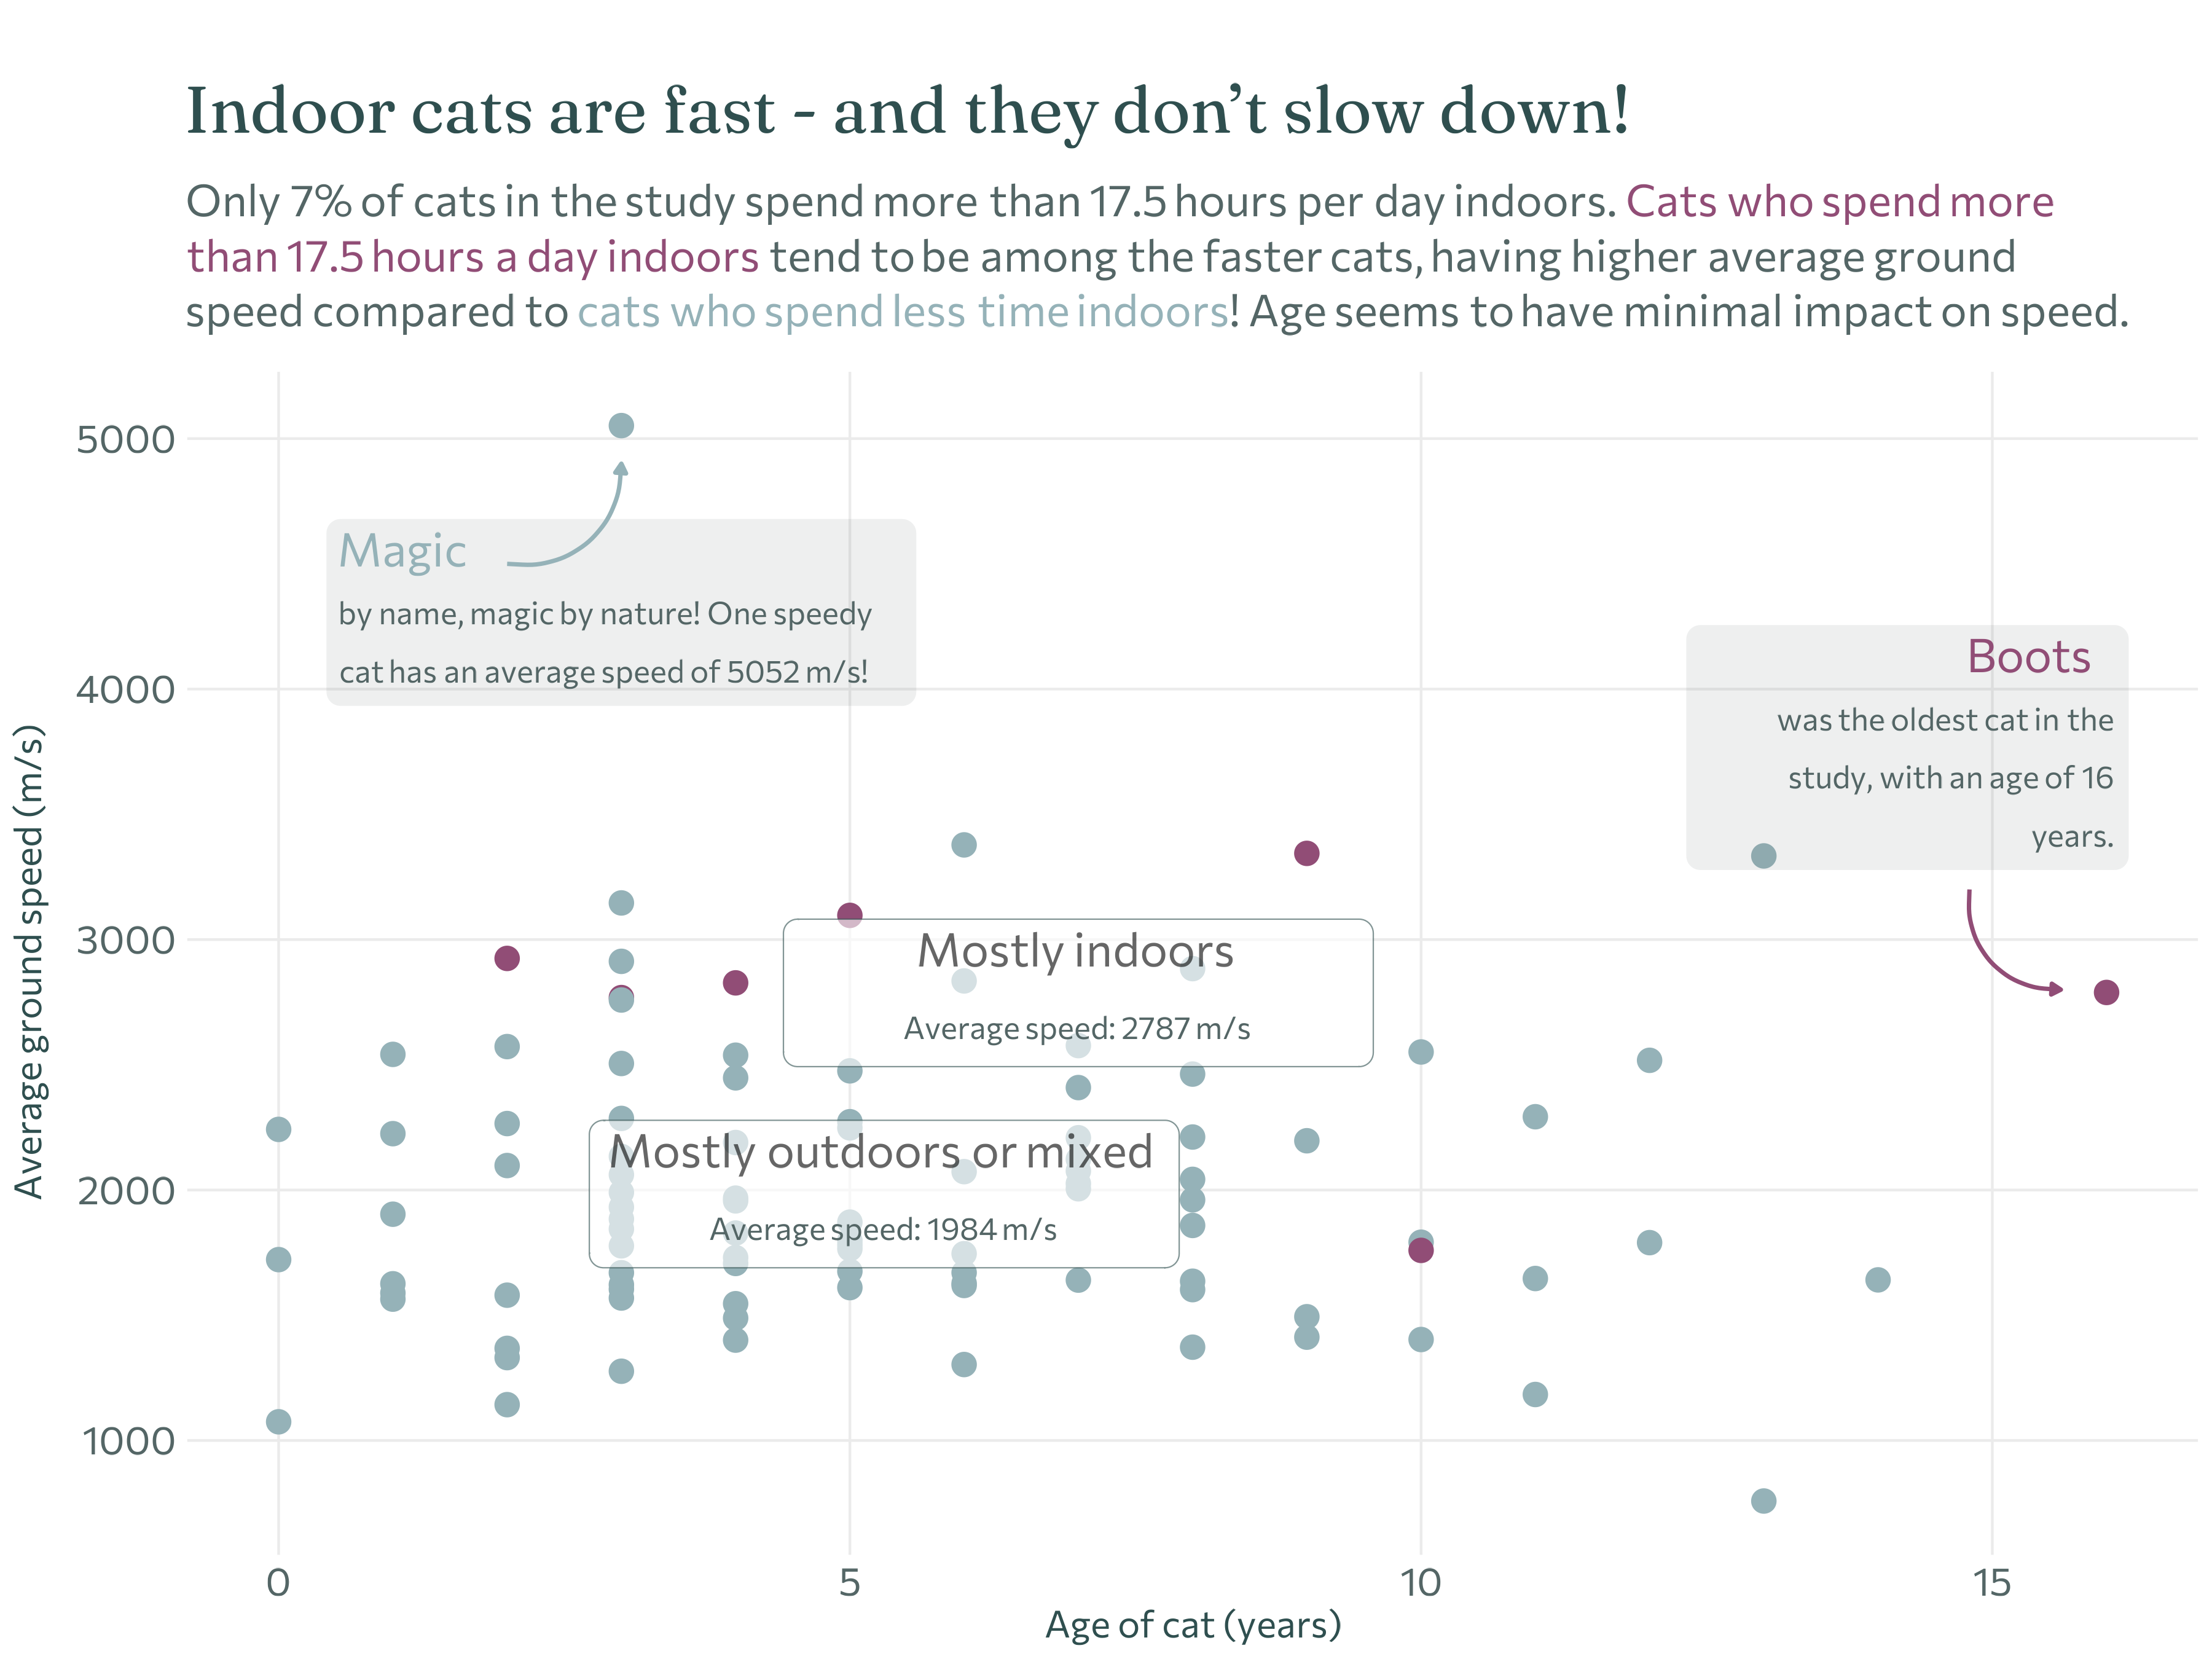
Nick Pechlivanis
Mar 21, 2023
Average ground speed: Cats
scatter
coloured text
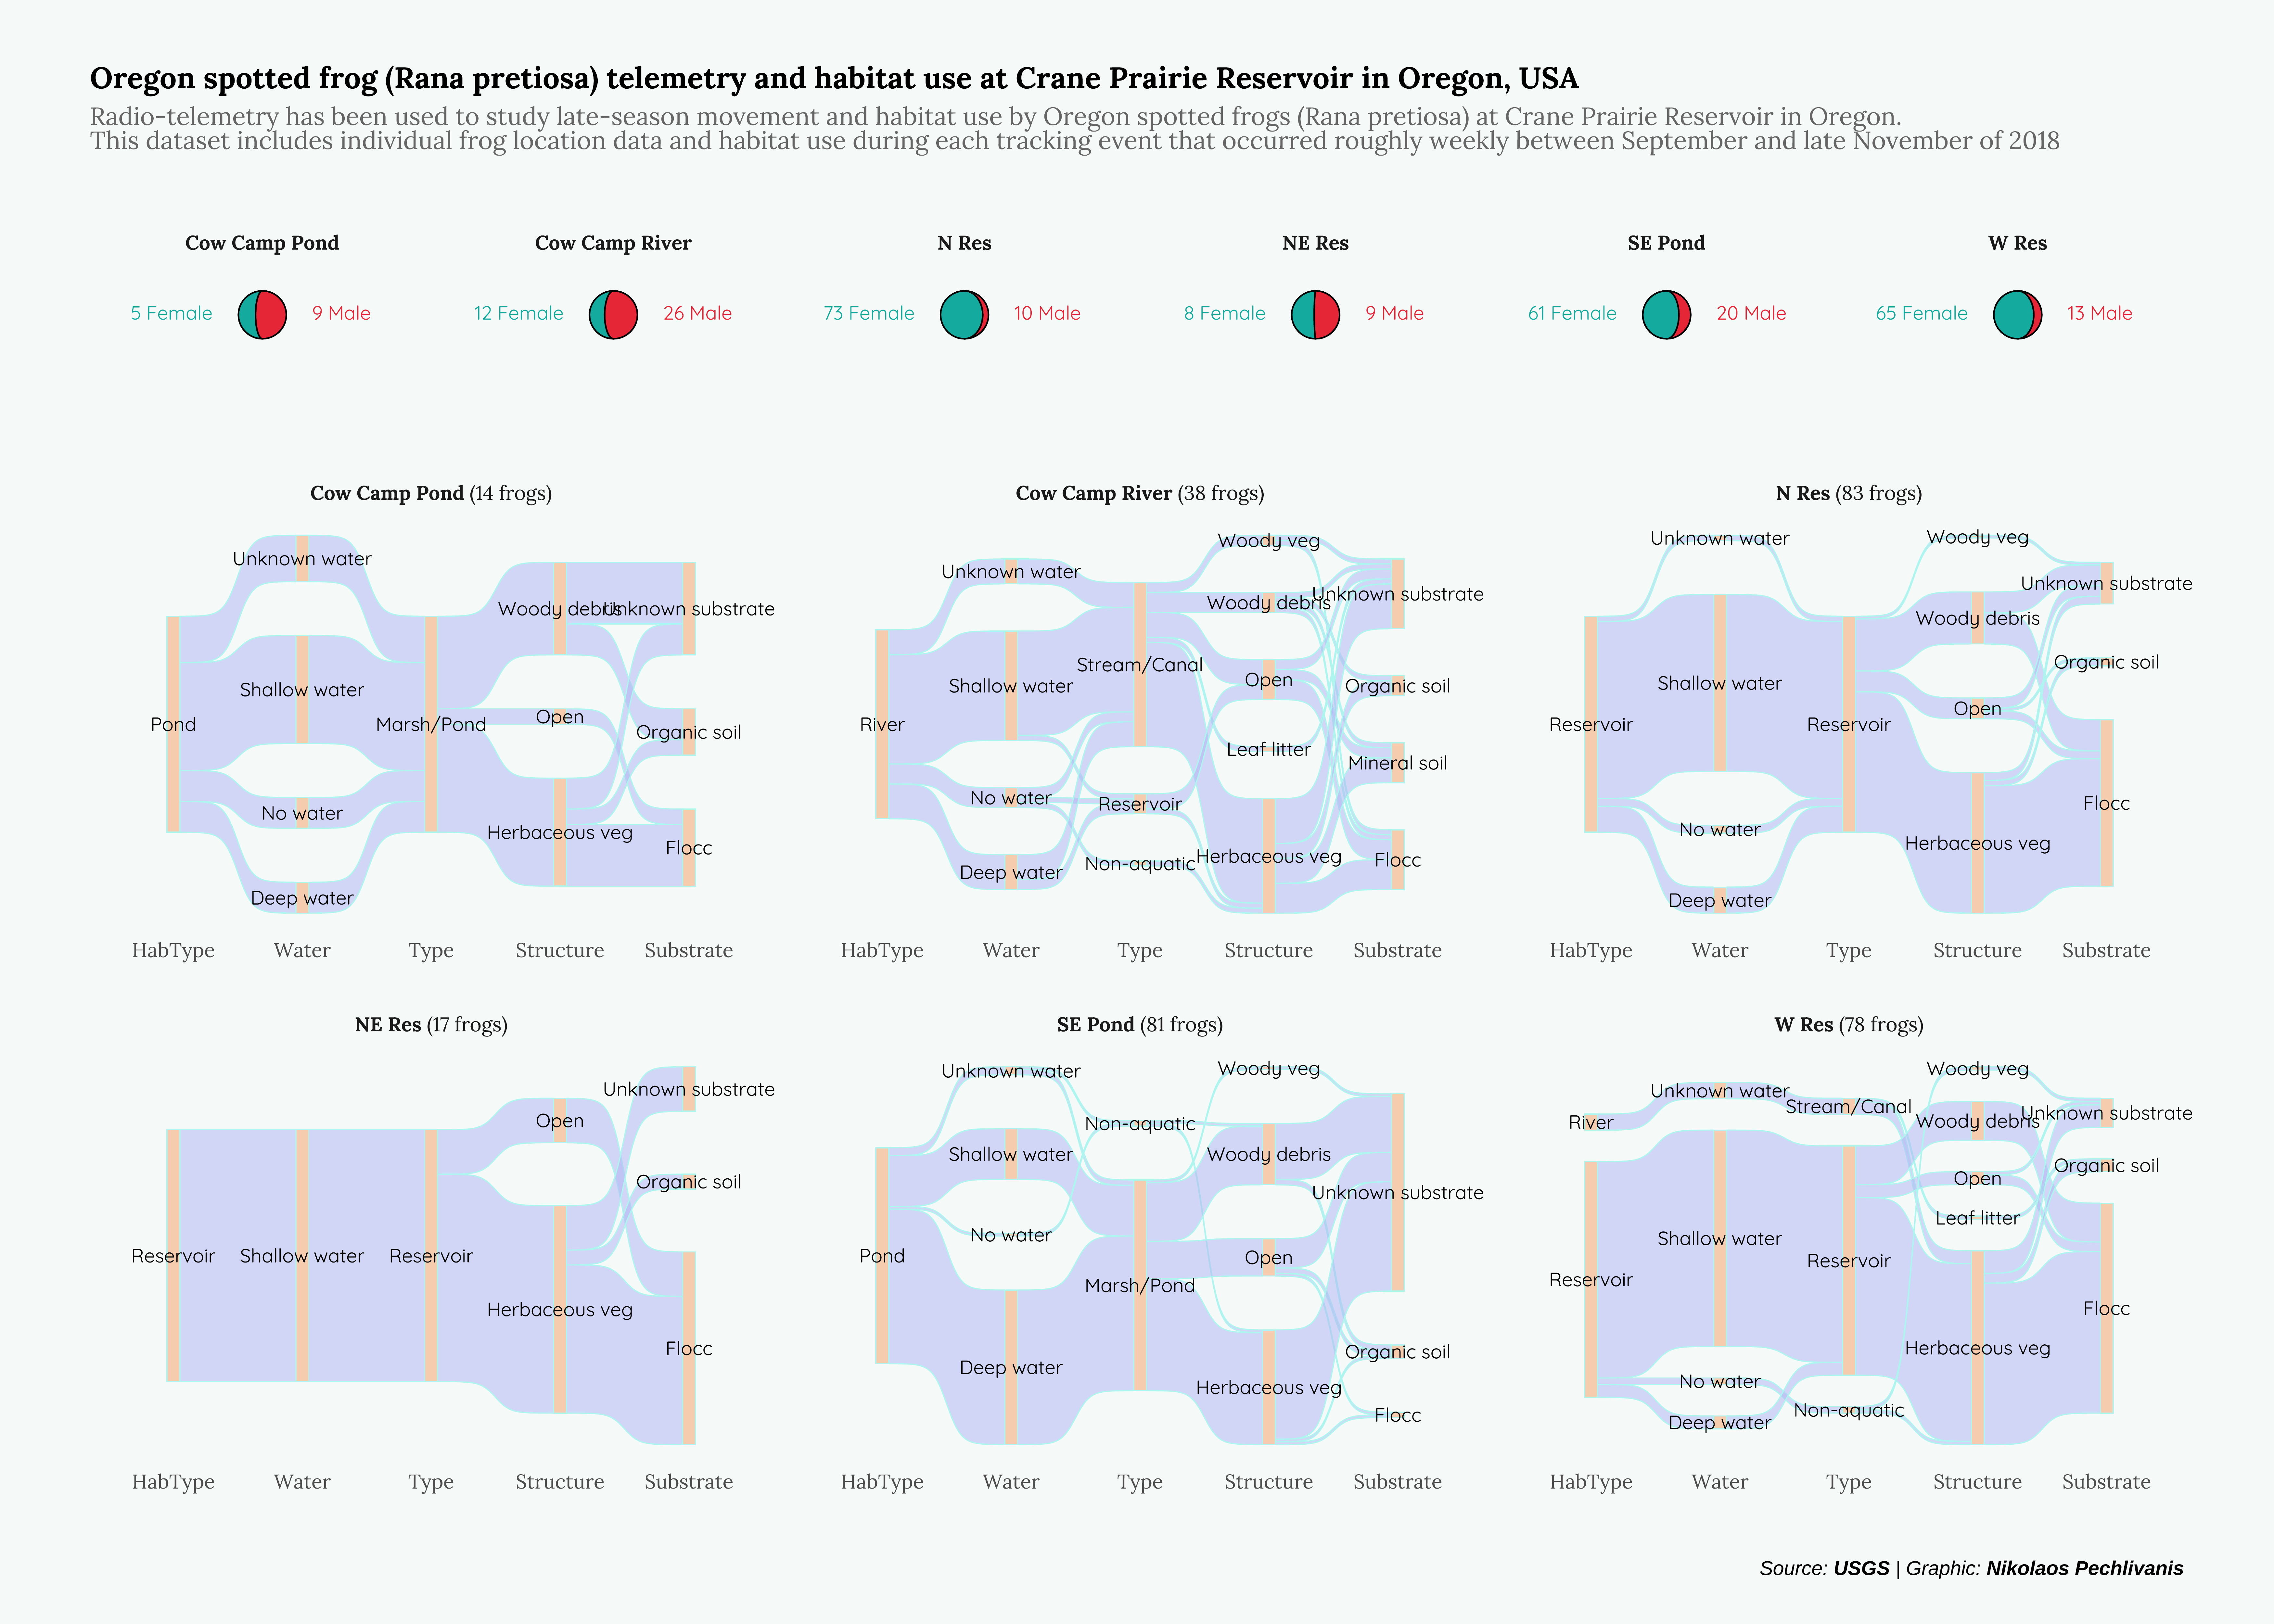
Nicola Rennie
Jan 31, 2023
Oregon Frog
polygon
segment
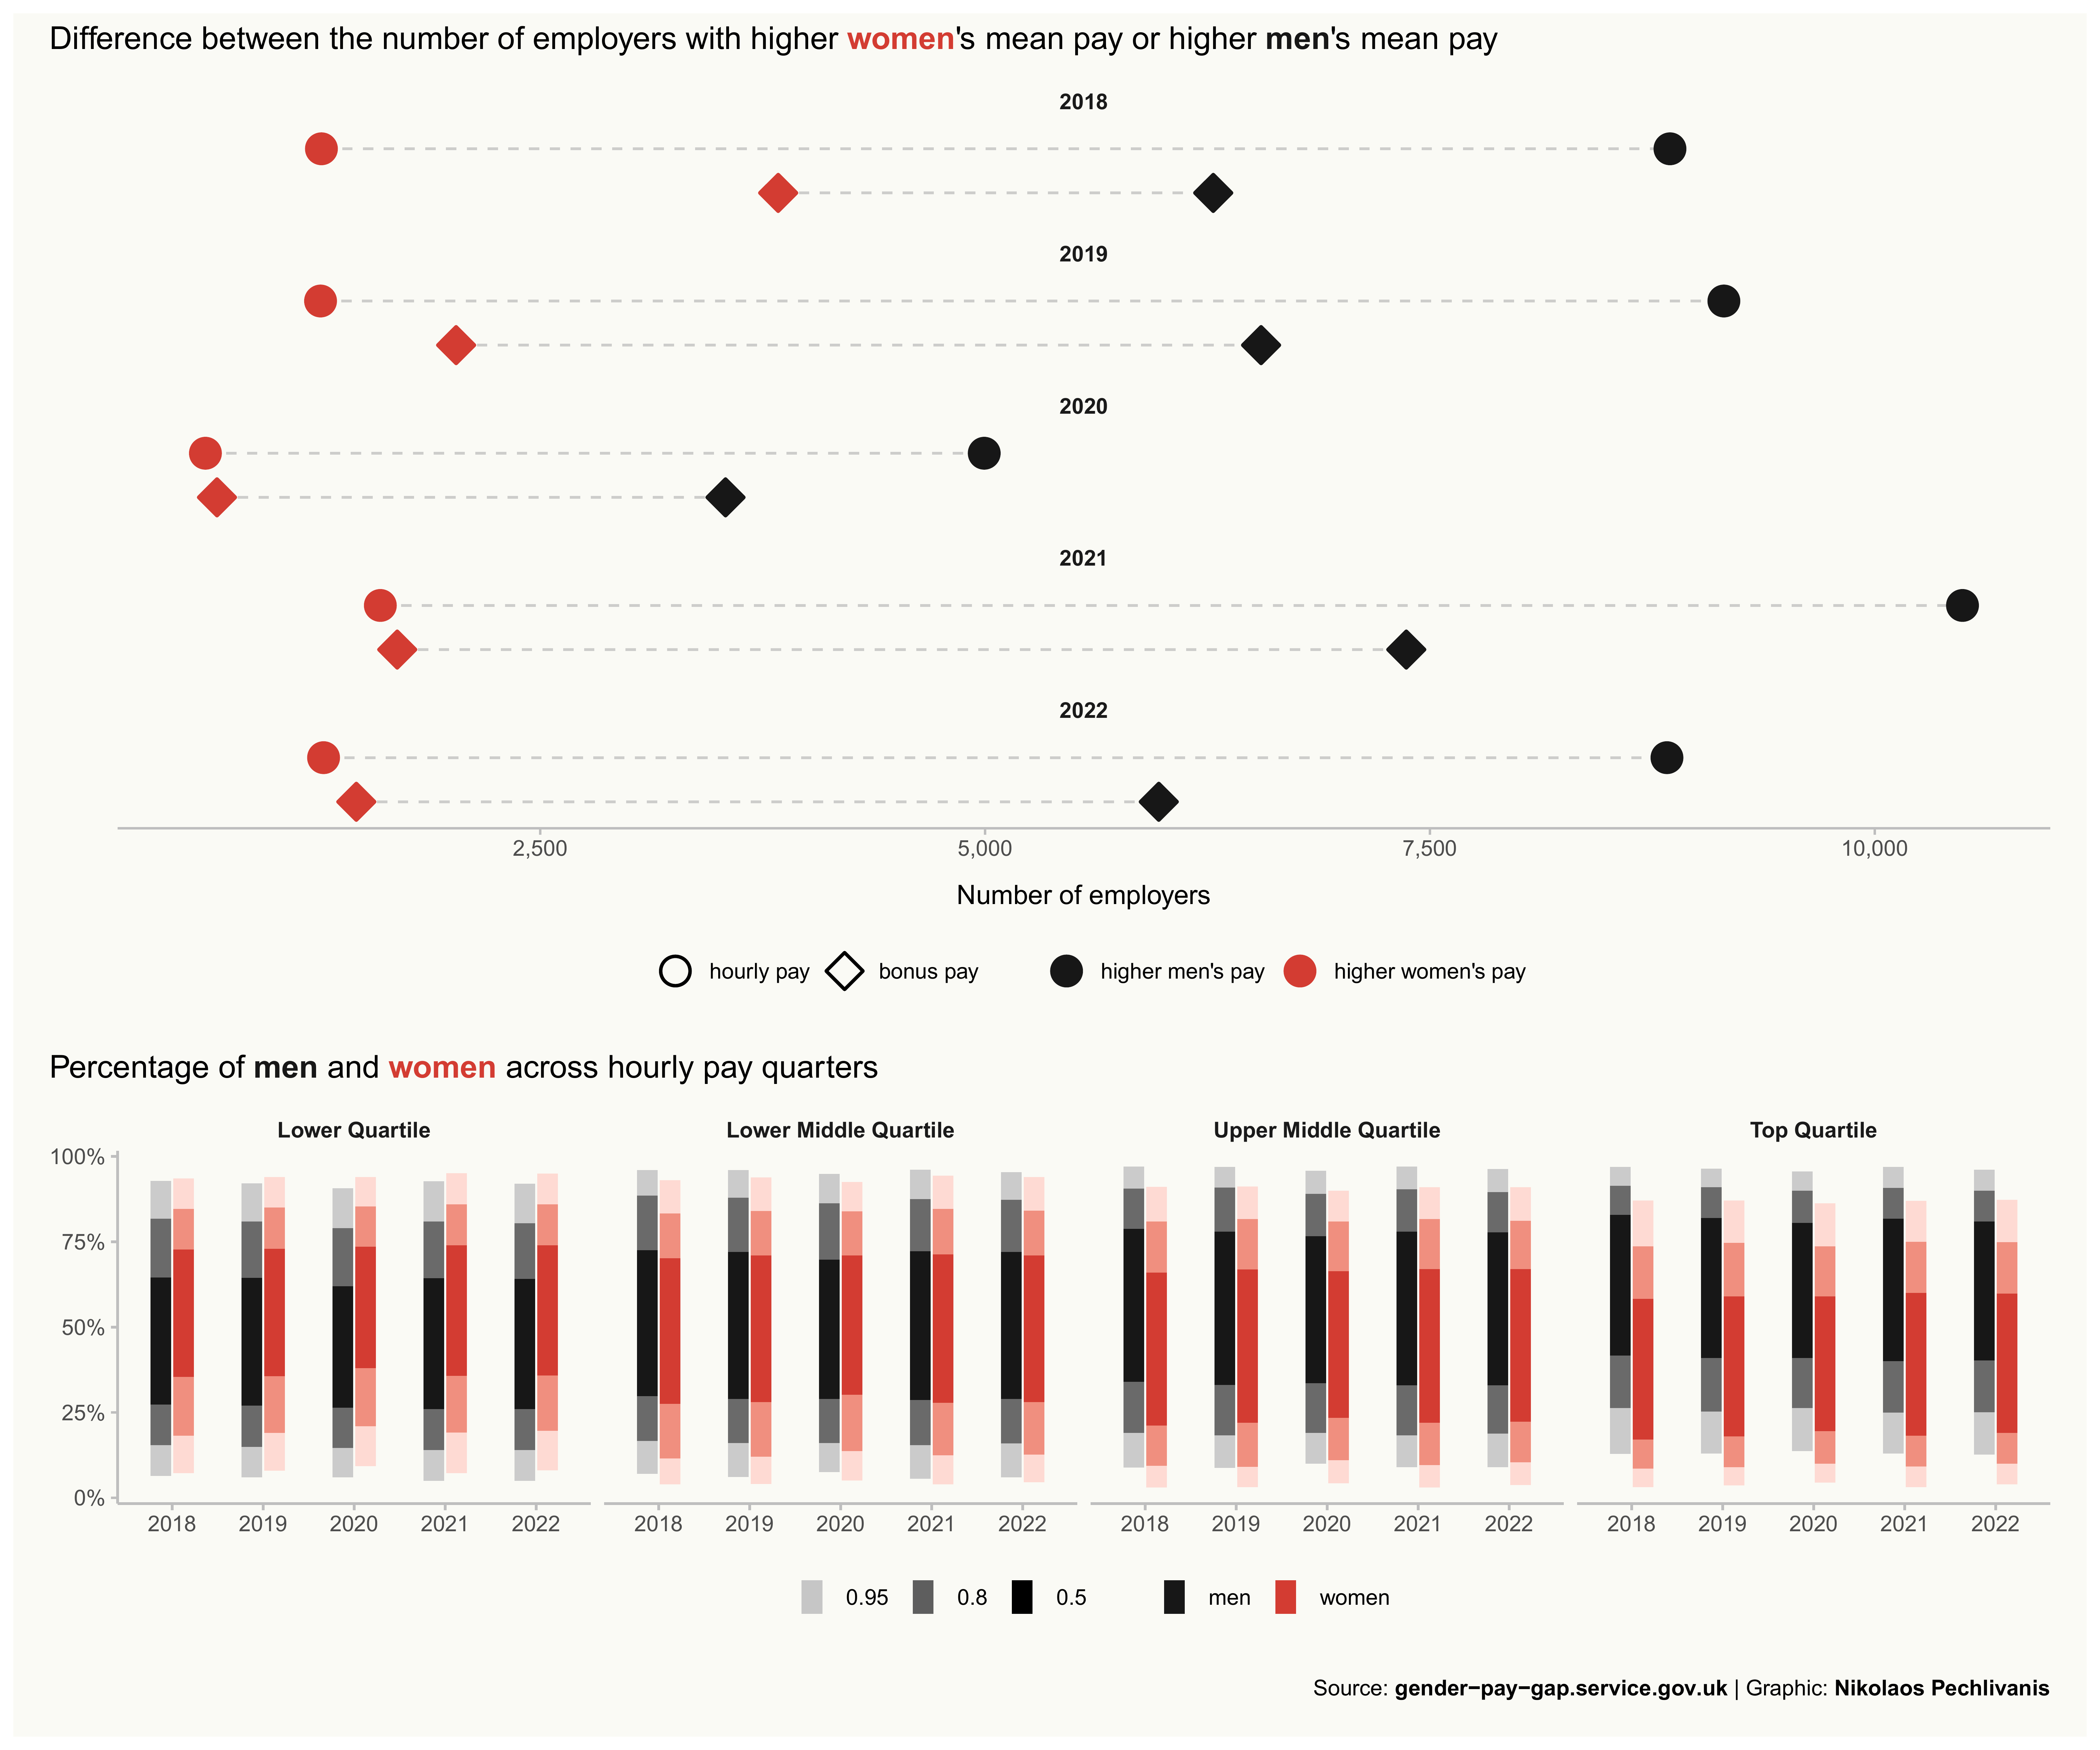
Nick Pechlivanis
Aug 2, 2022
UK Gender Pay Gap
bar
connected plot
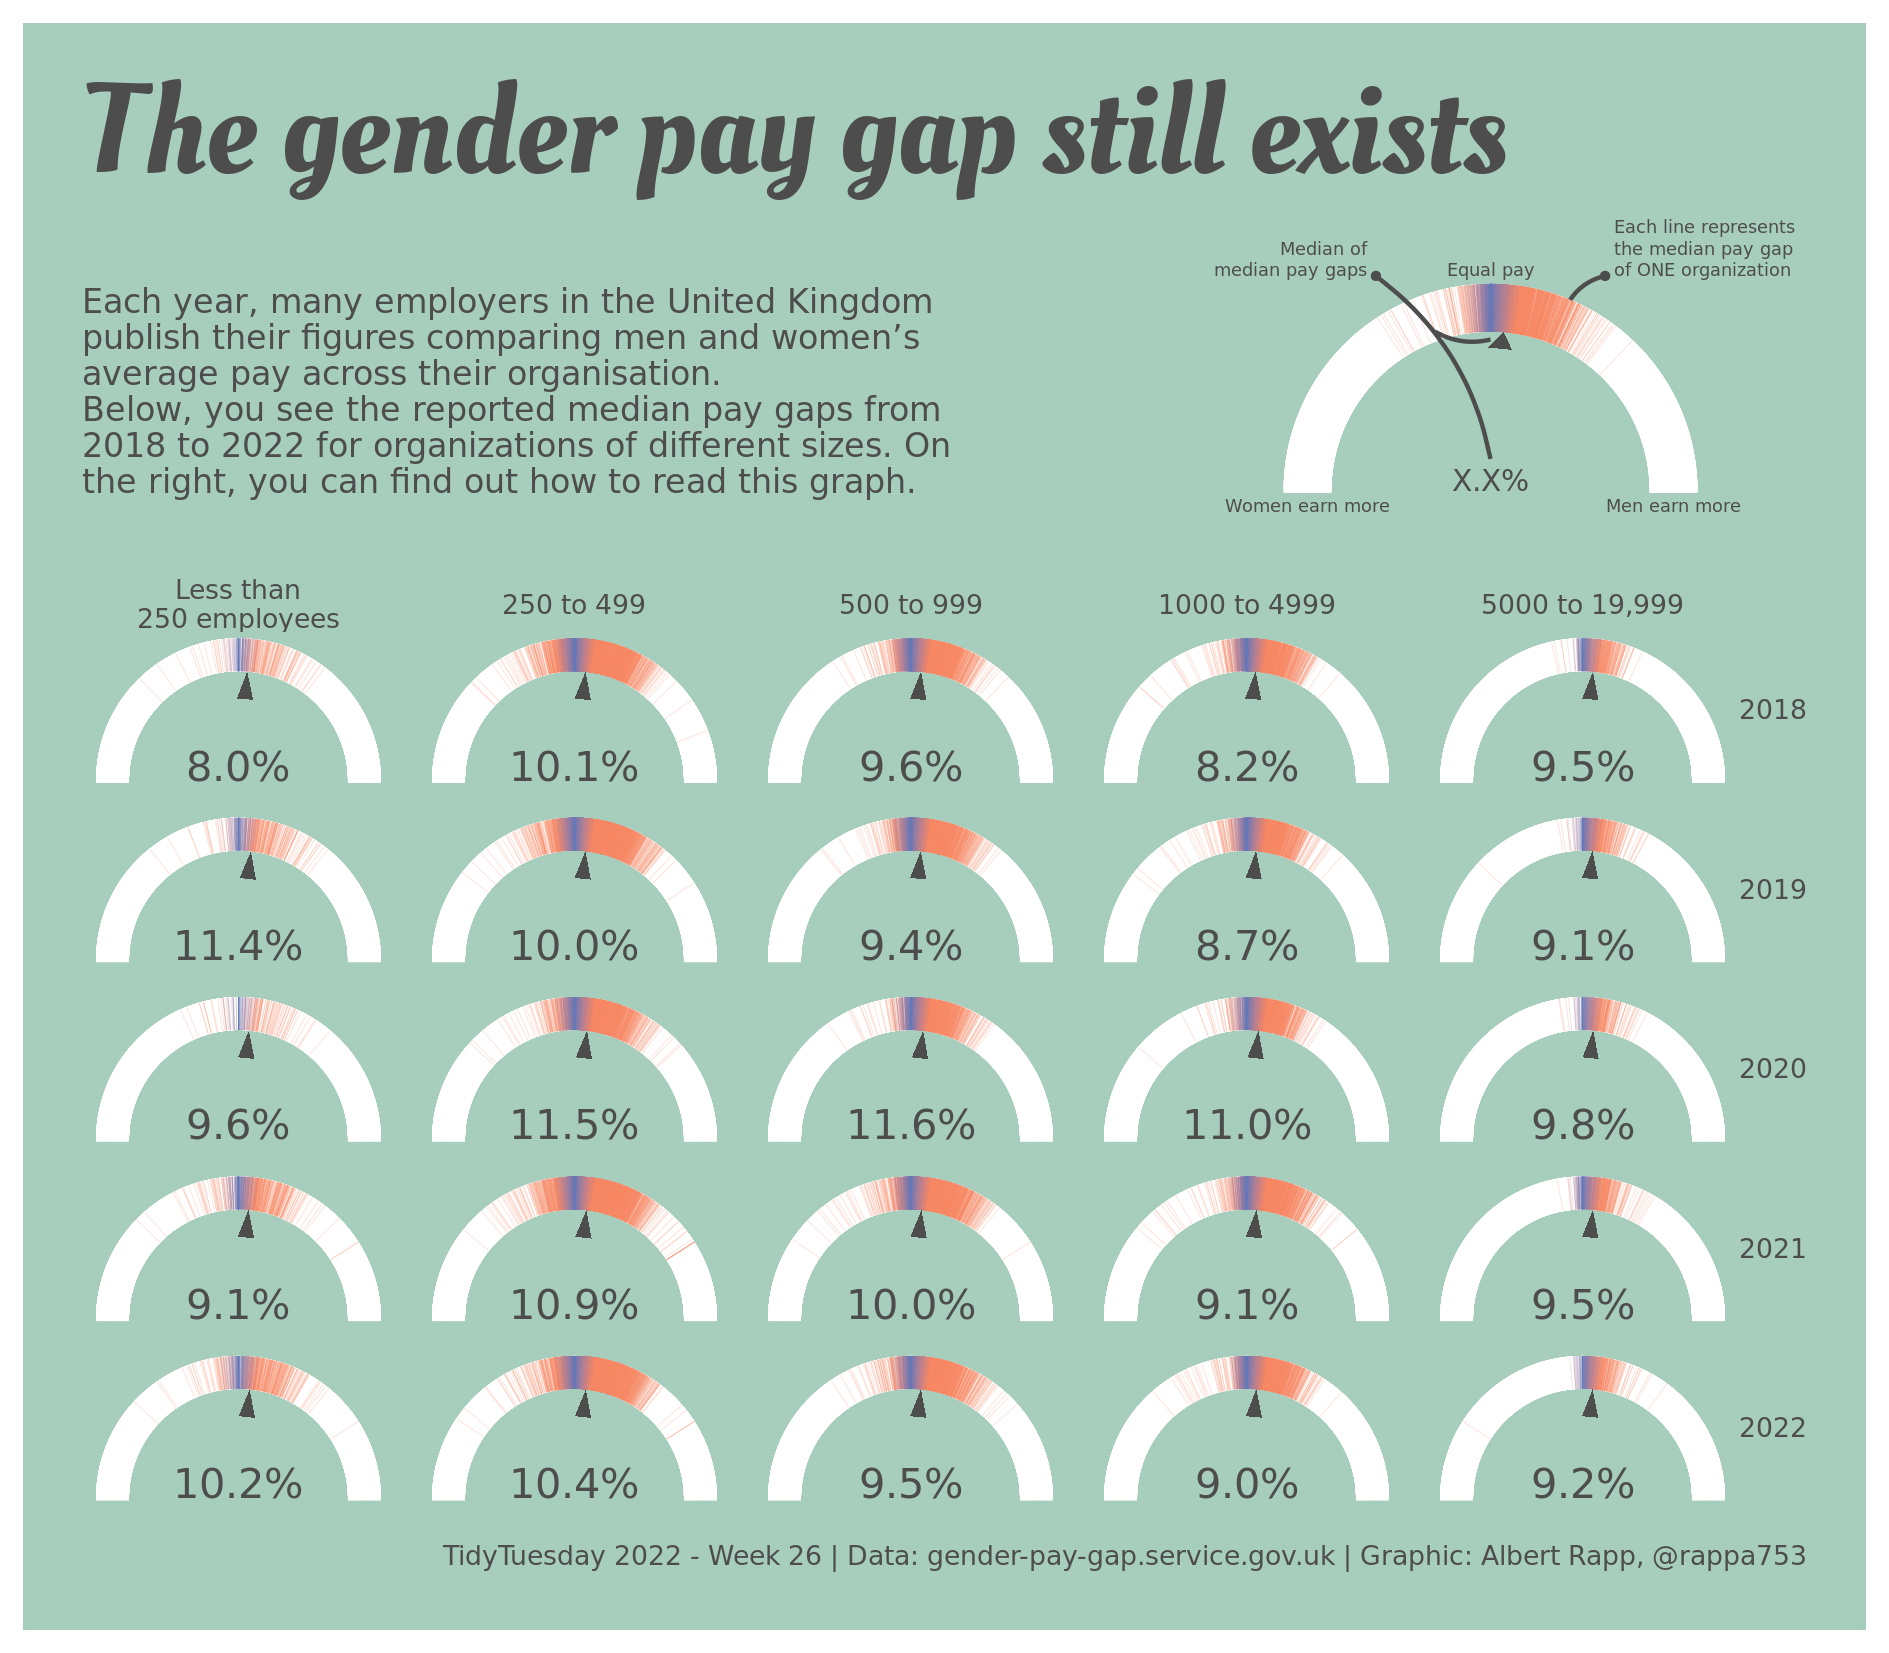
Nick Pechlivanis
Jun 28, 2022
UK Gender Pay Gap
polygon
segment
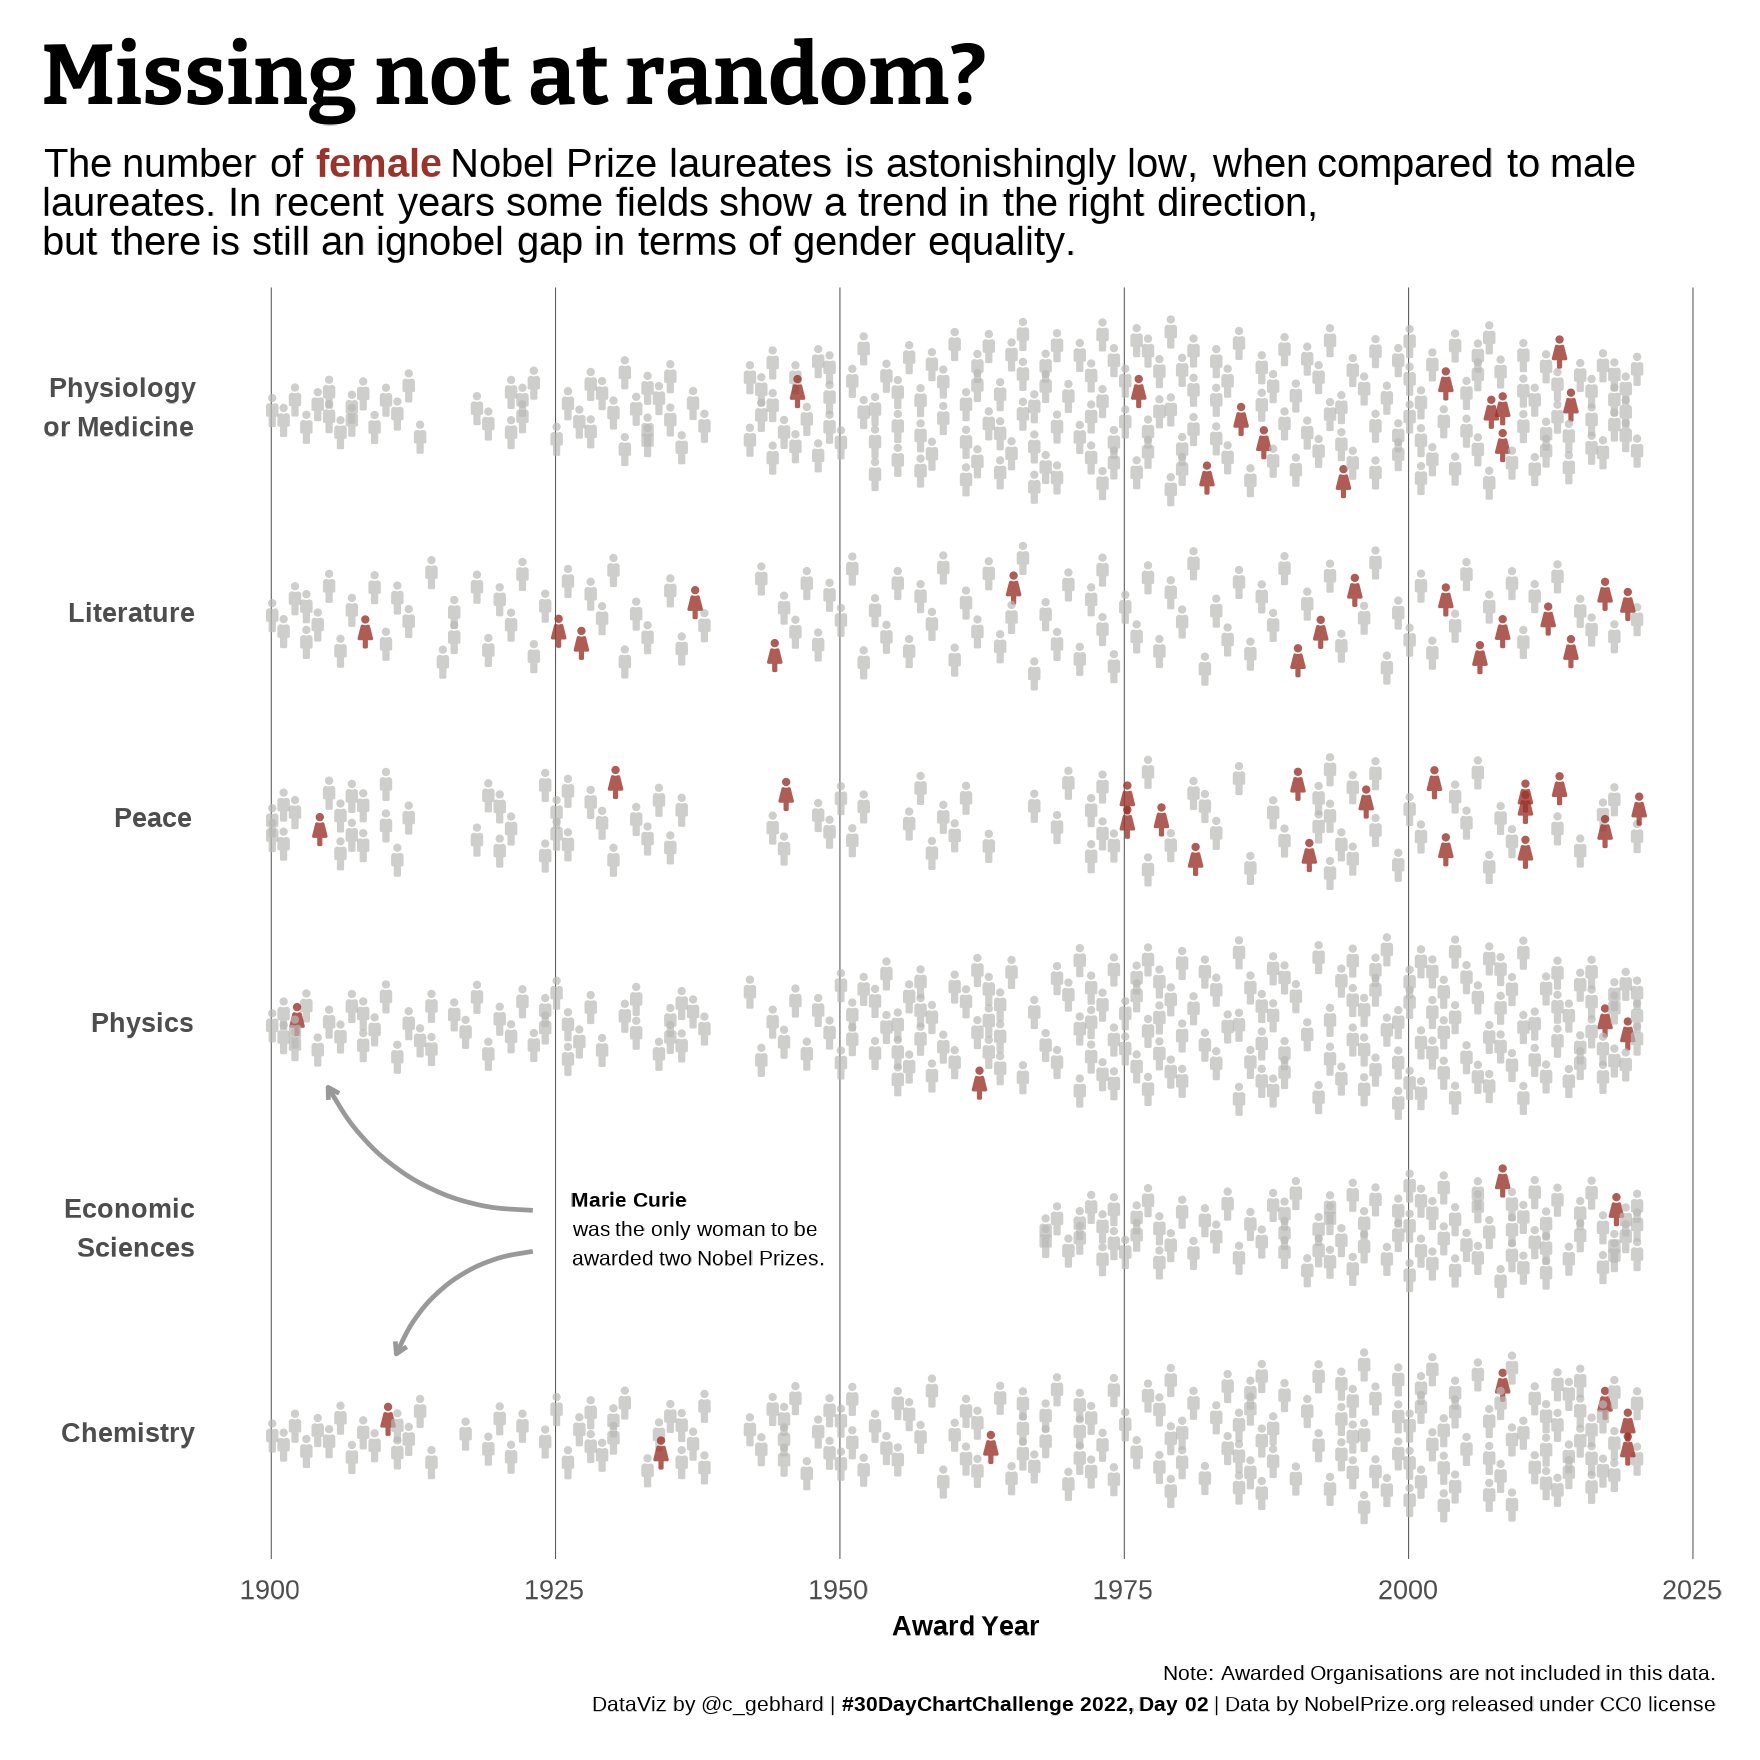
Albert Rapp
Jun 26, 2022
Nobel winners by gender
scatter
icons
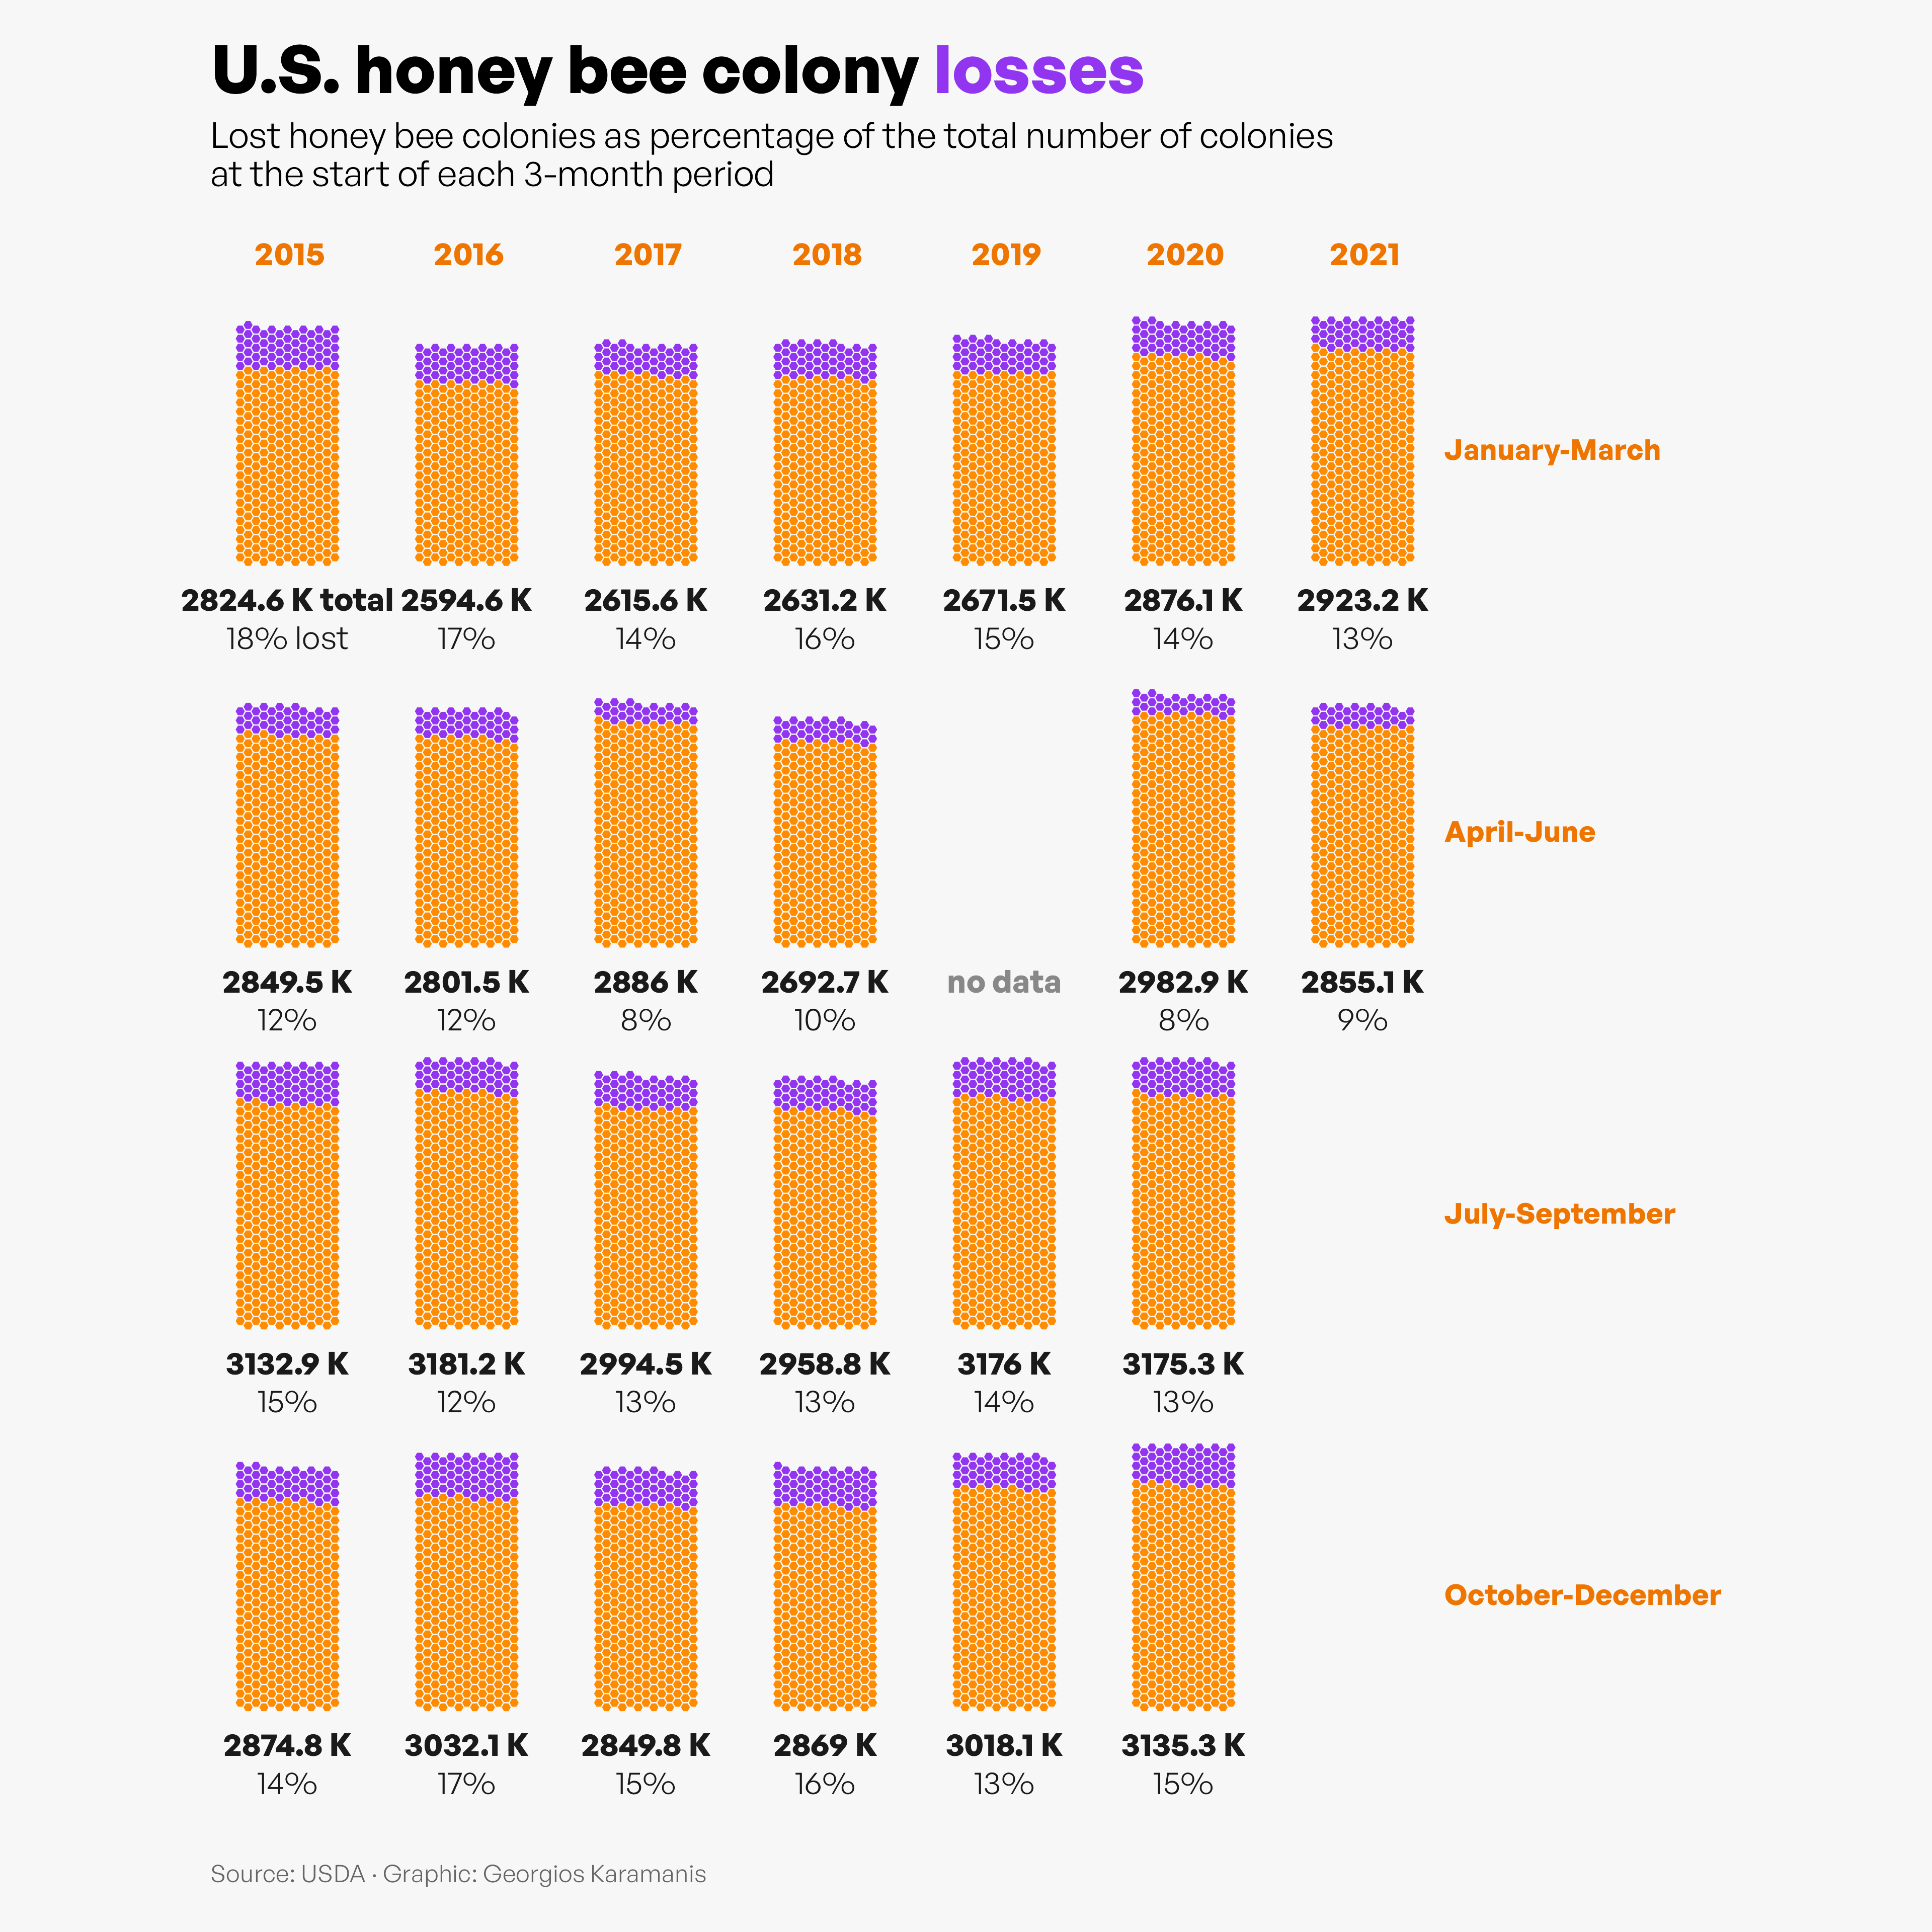
Cara Thompson
Apr 2, 2022
Honey bee colony losses
bar
polygon
icons
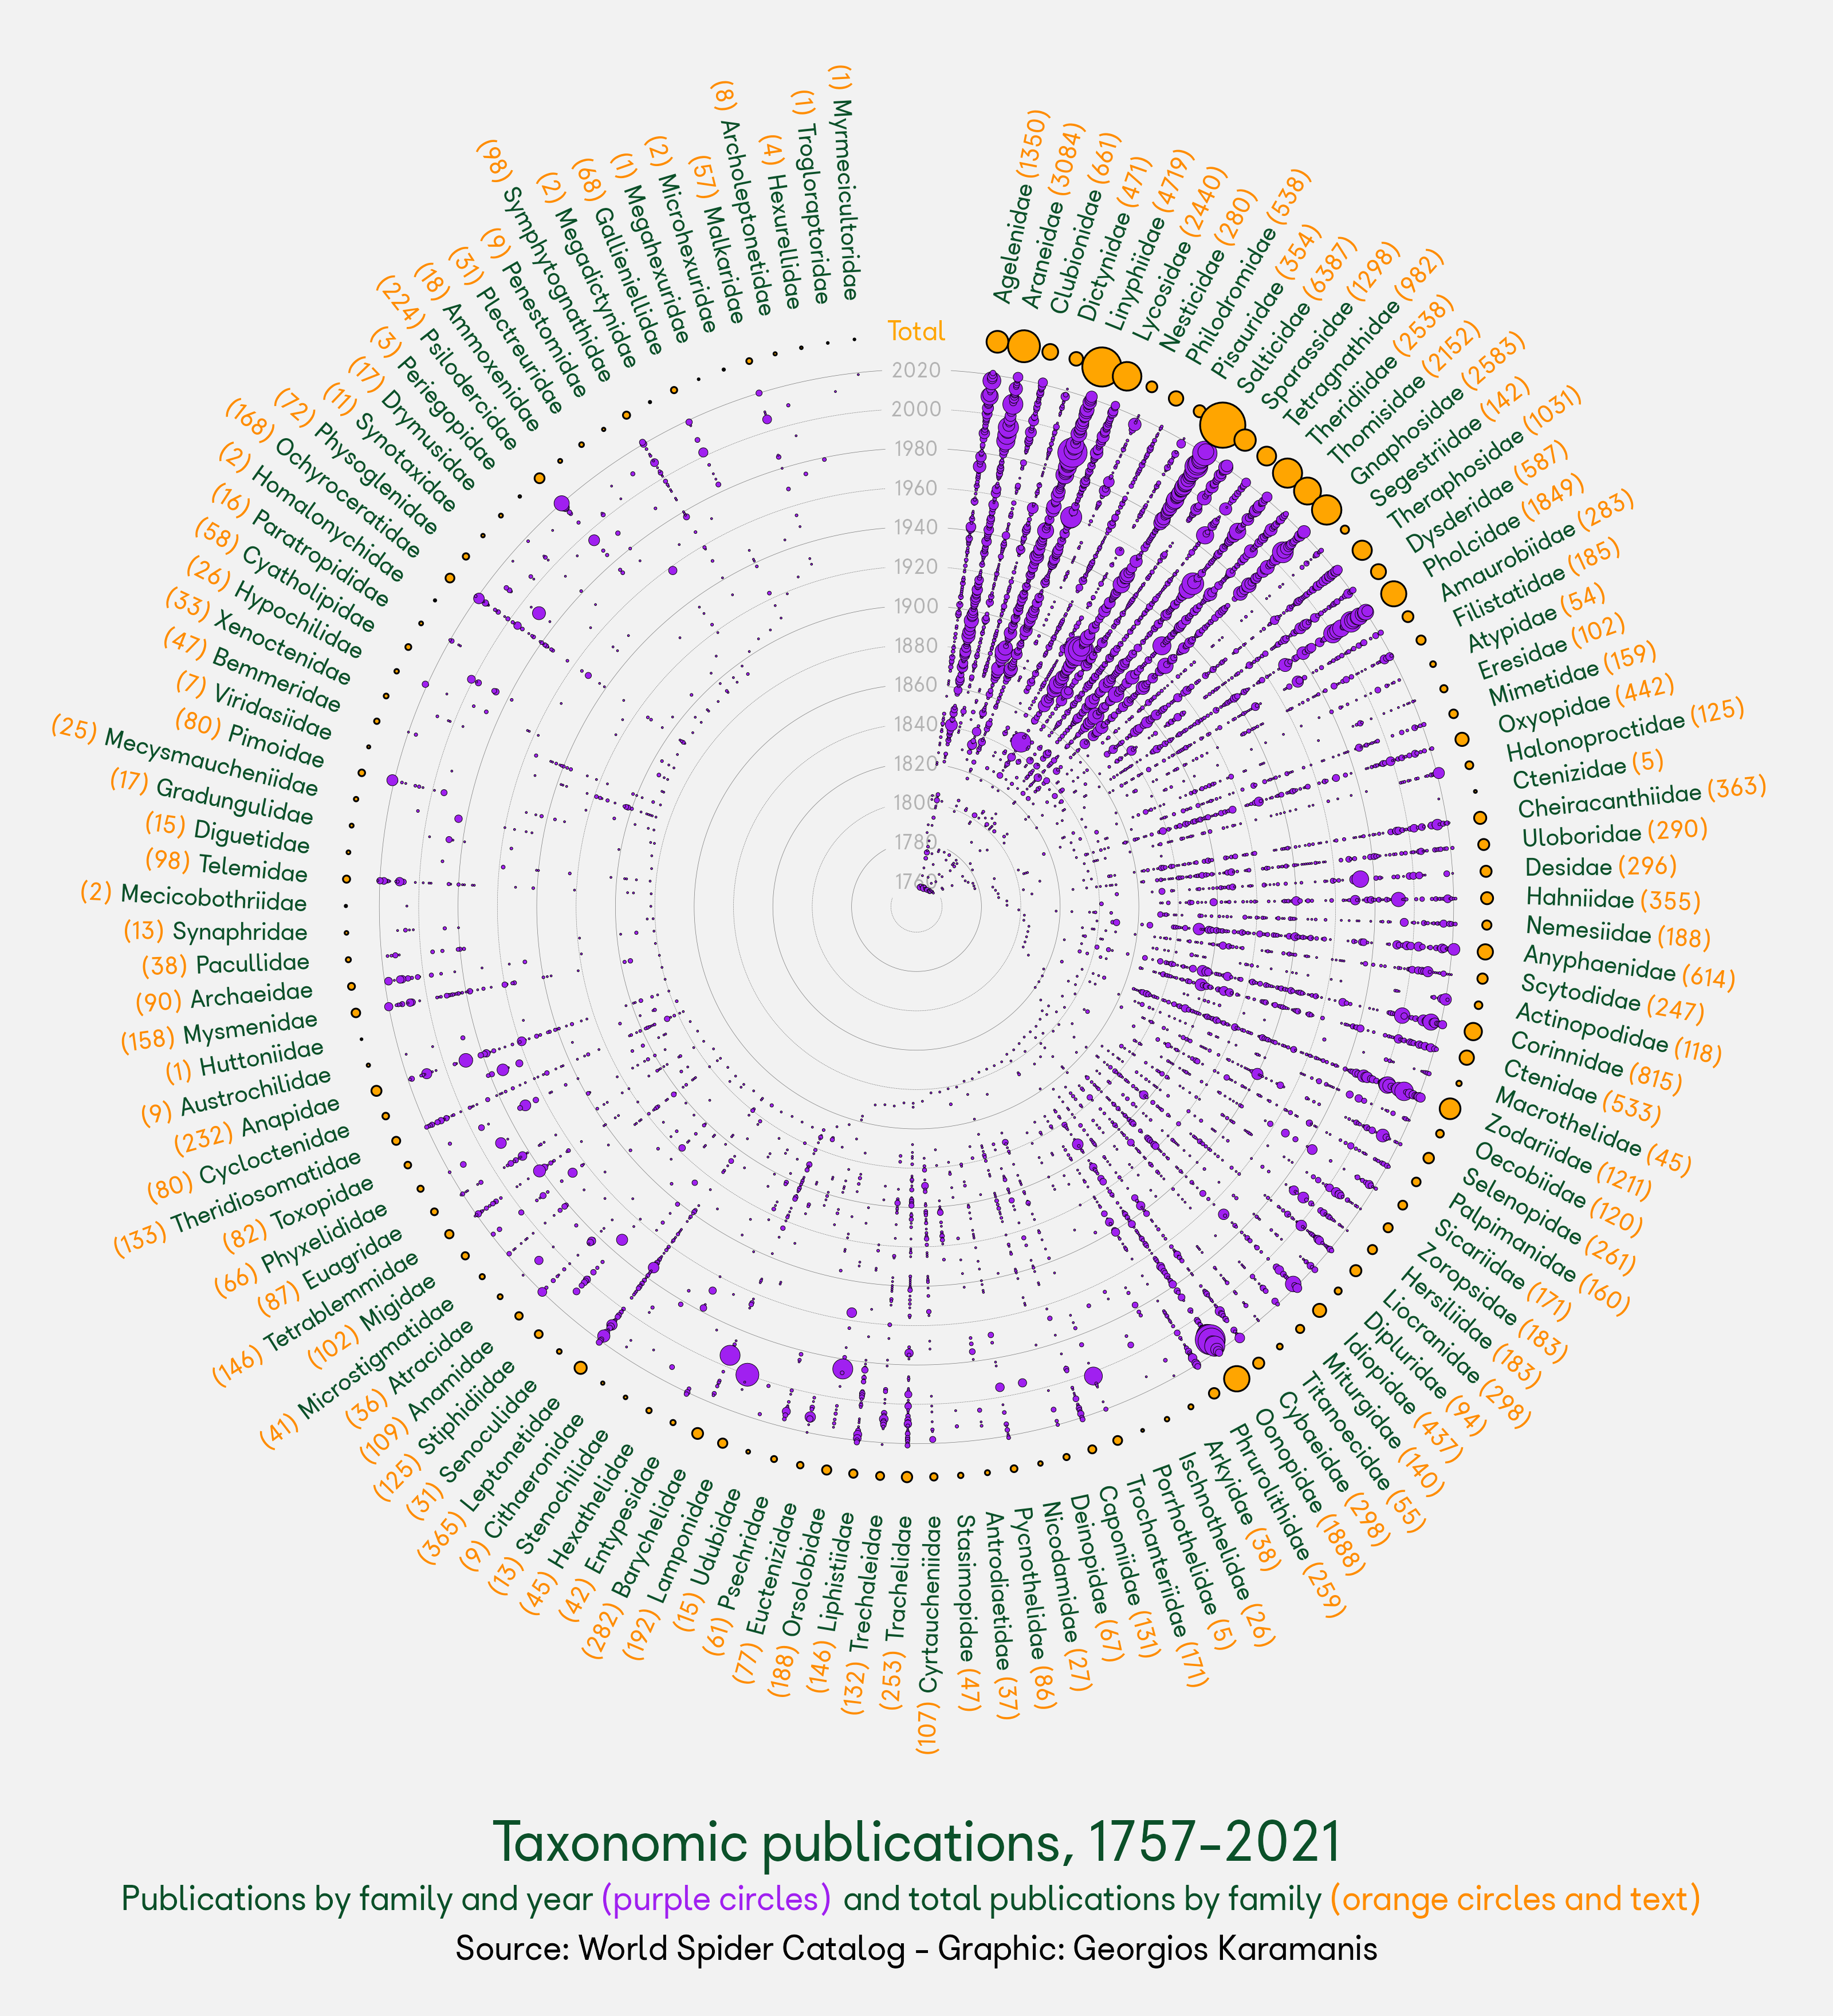
George Karamanis
Jan 14, 2022
Taxonomy of publications
round
bubbles
text
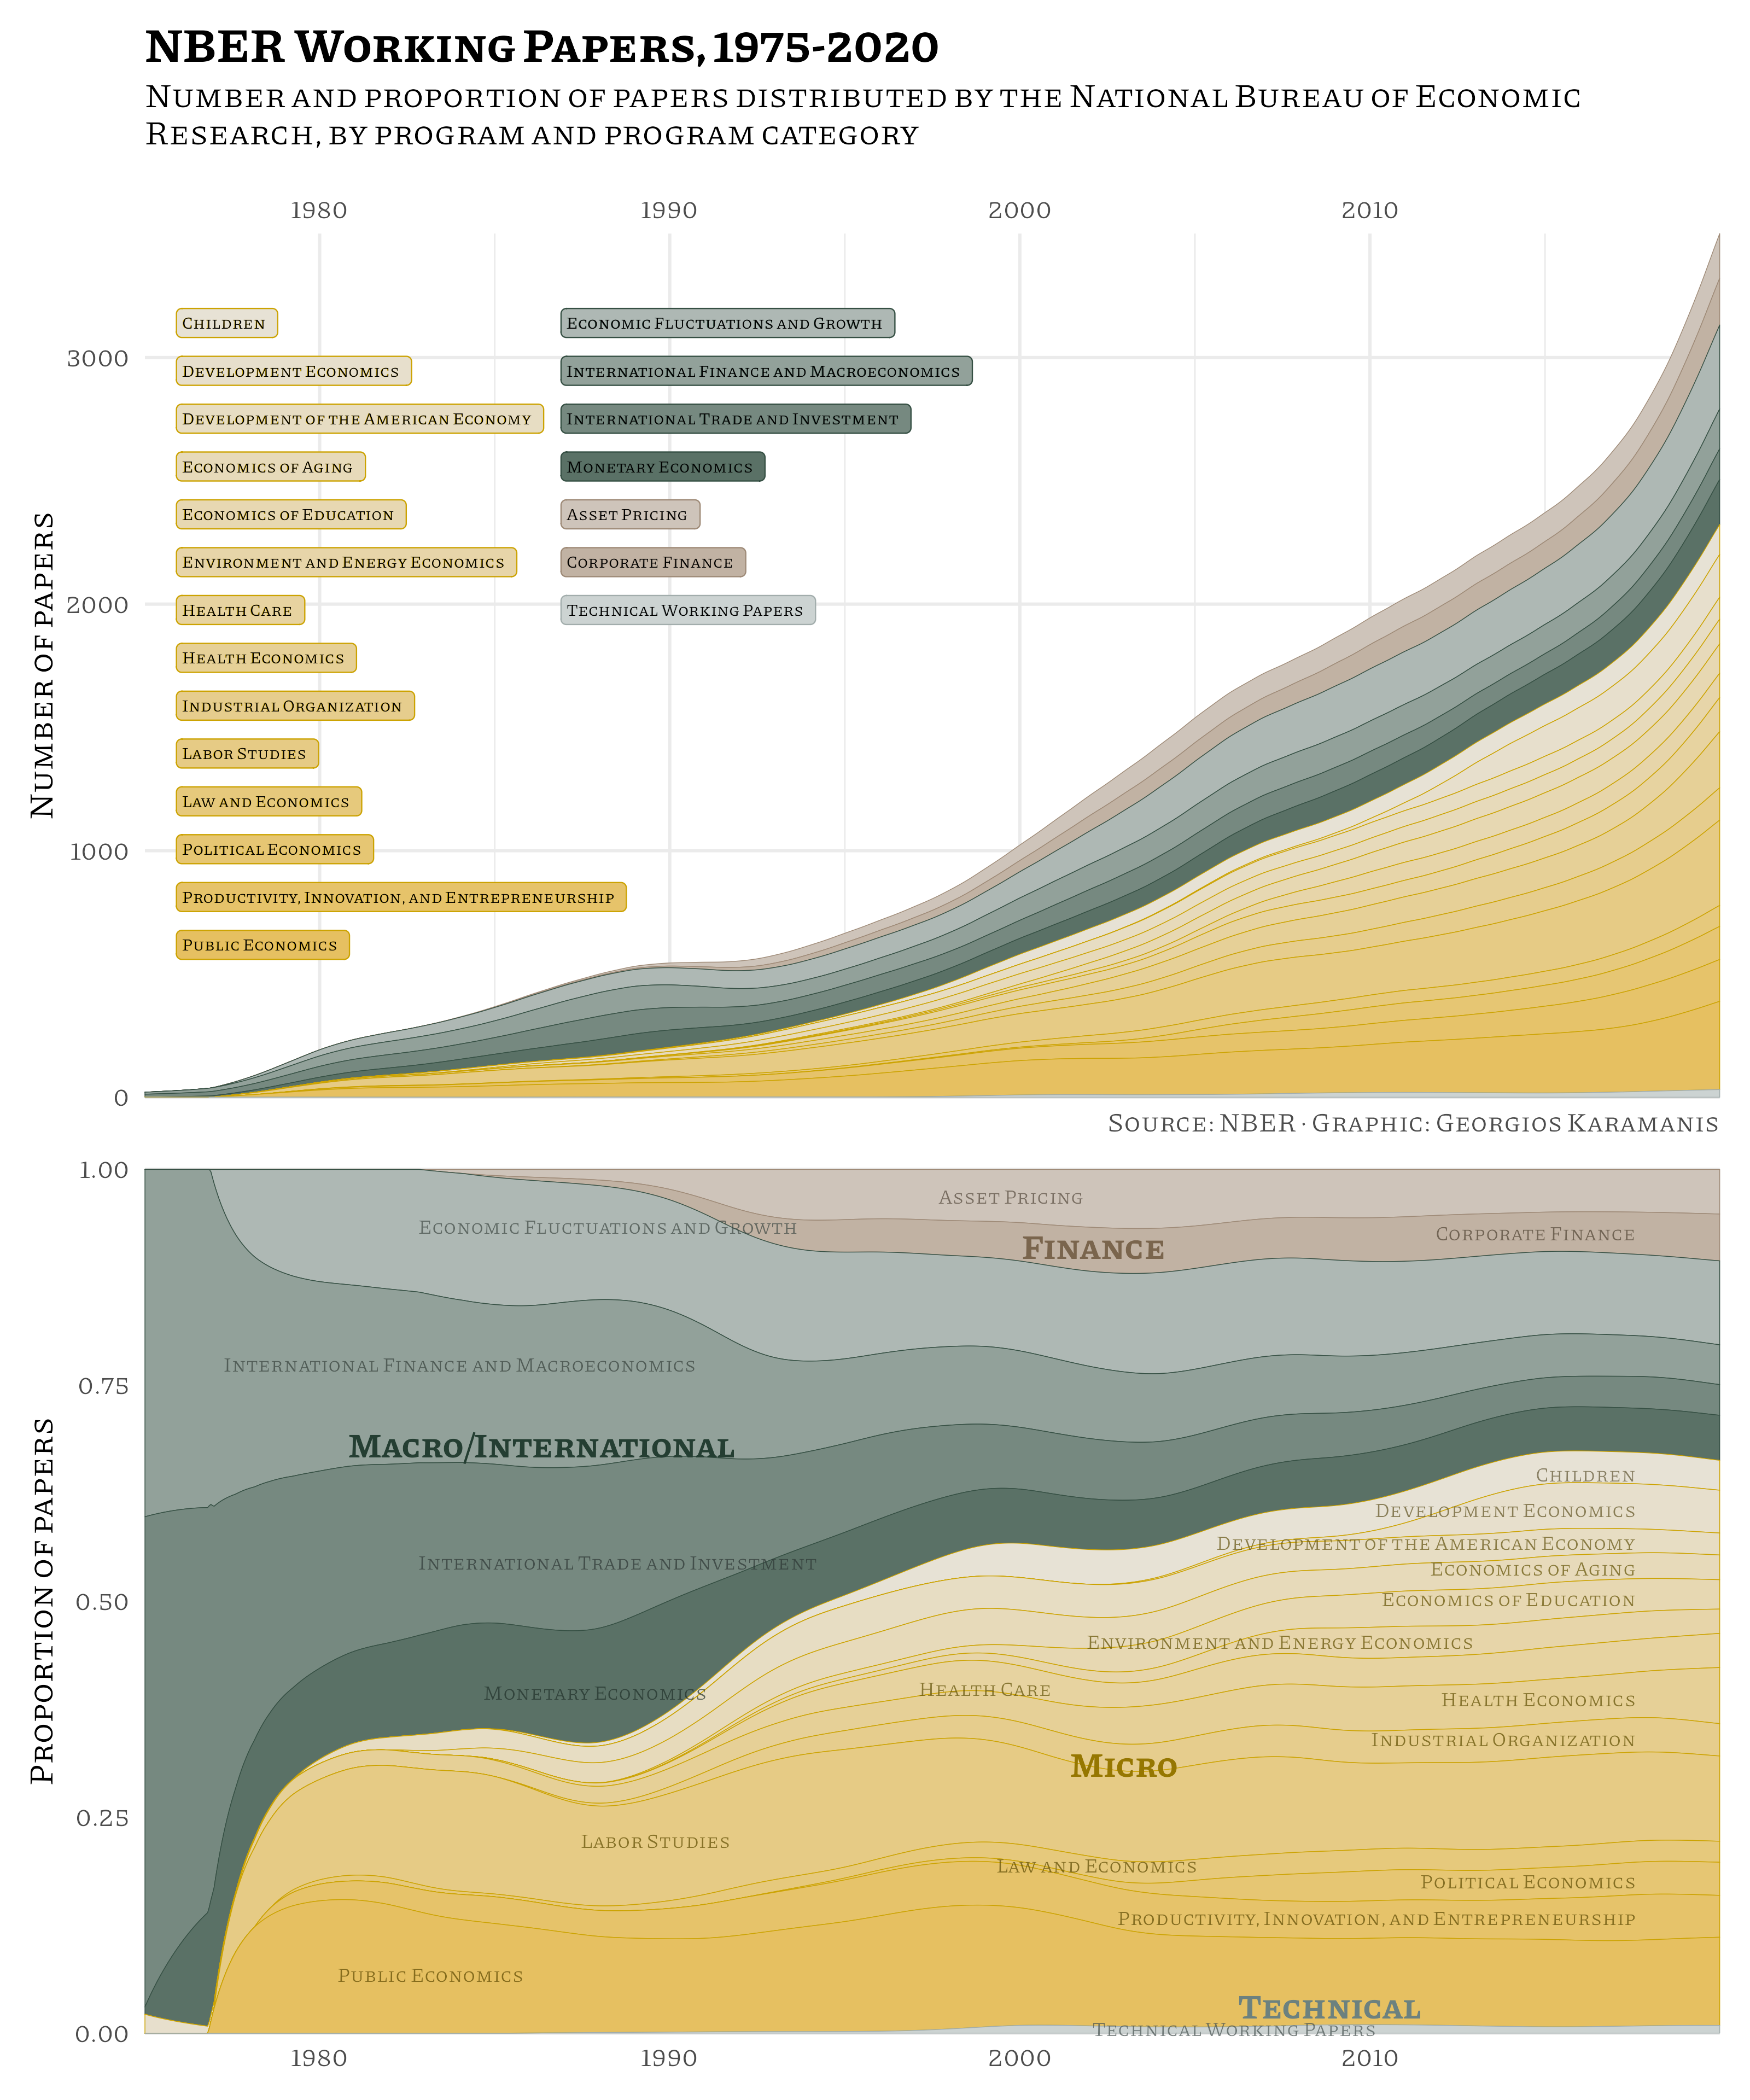
George Karamanis
Dec 10, 2021
NBER papers
area
stream
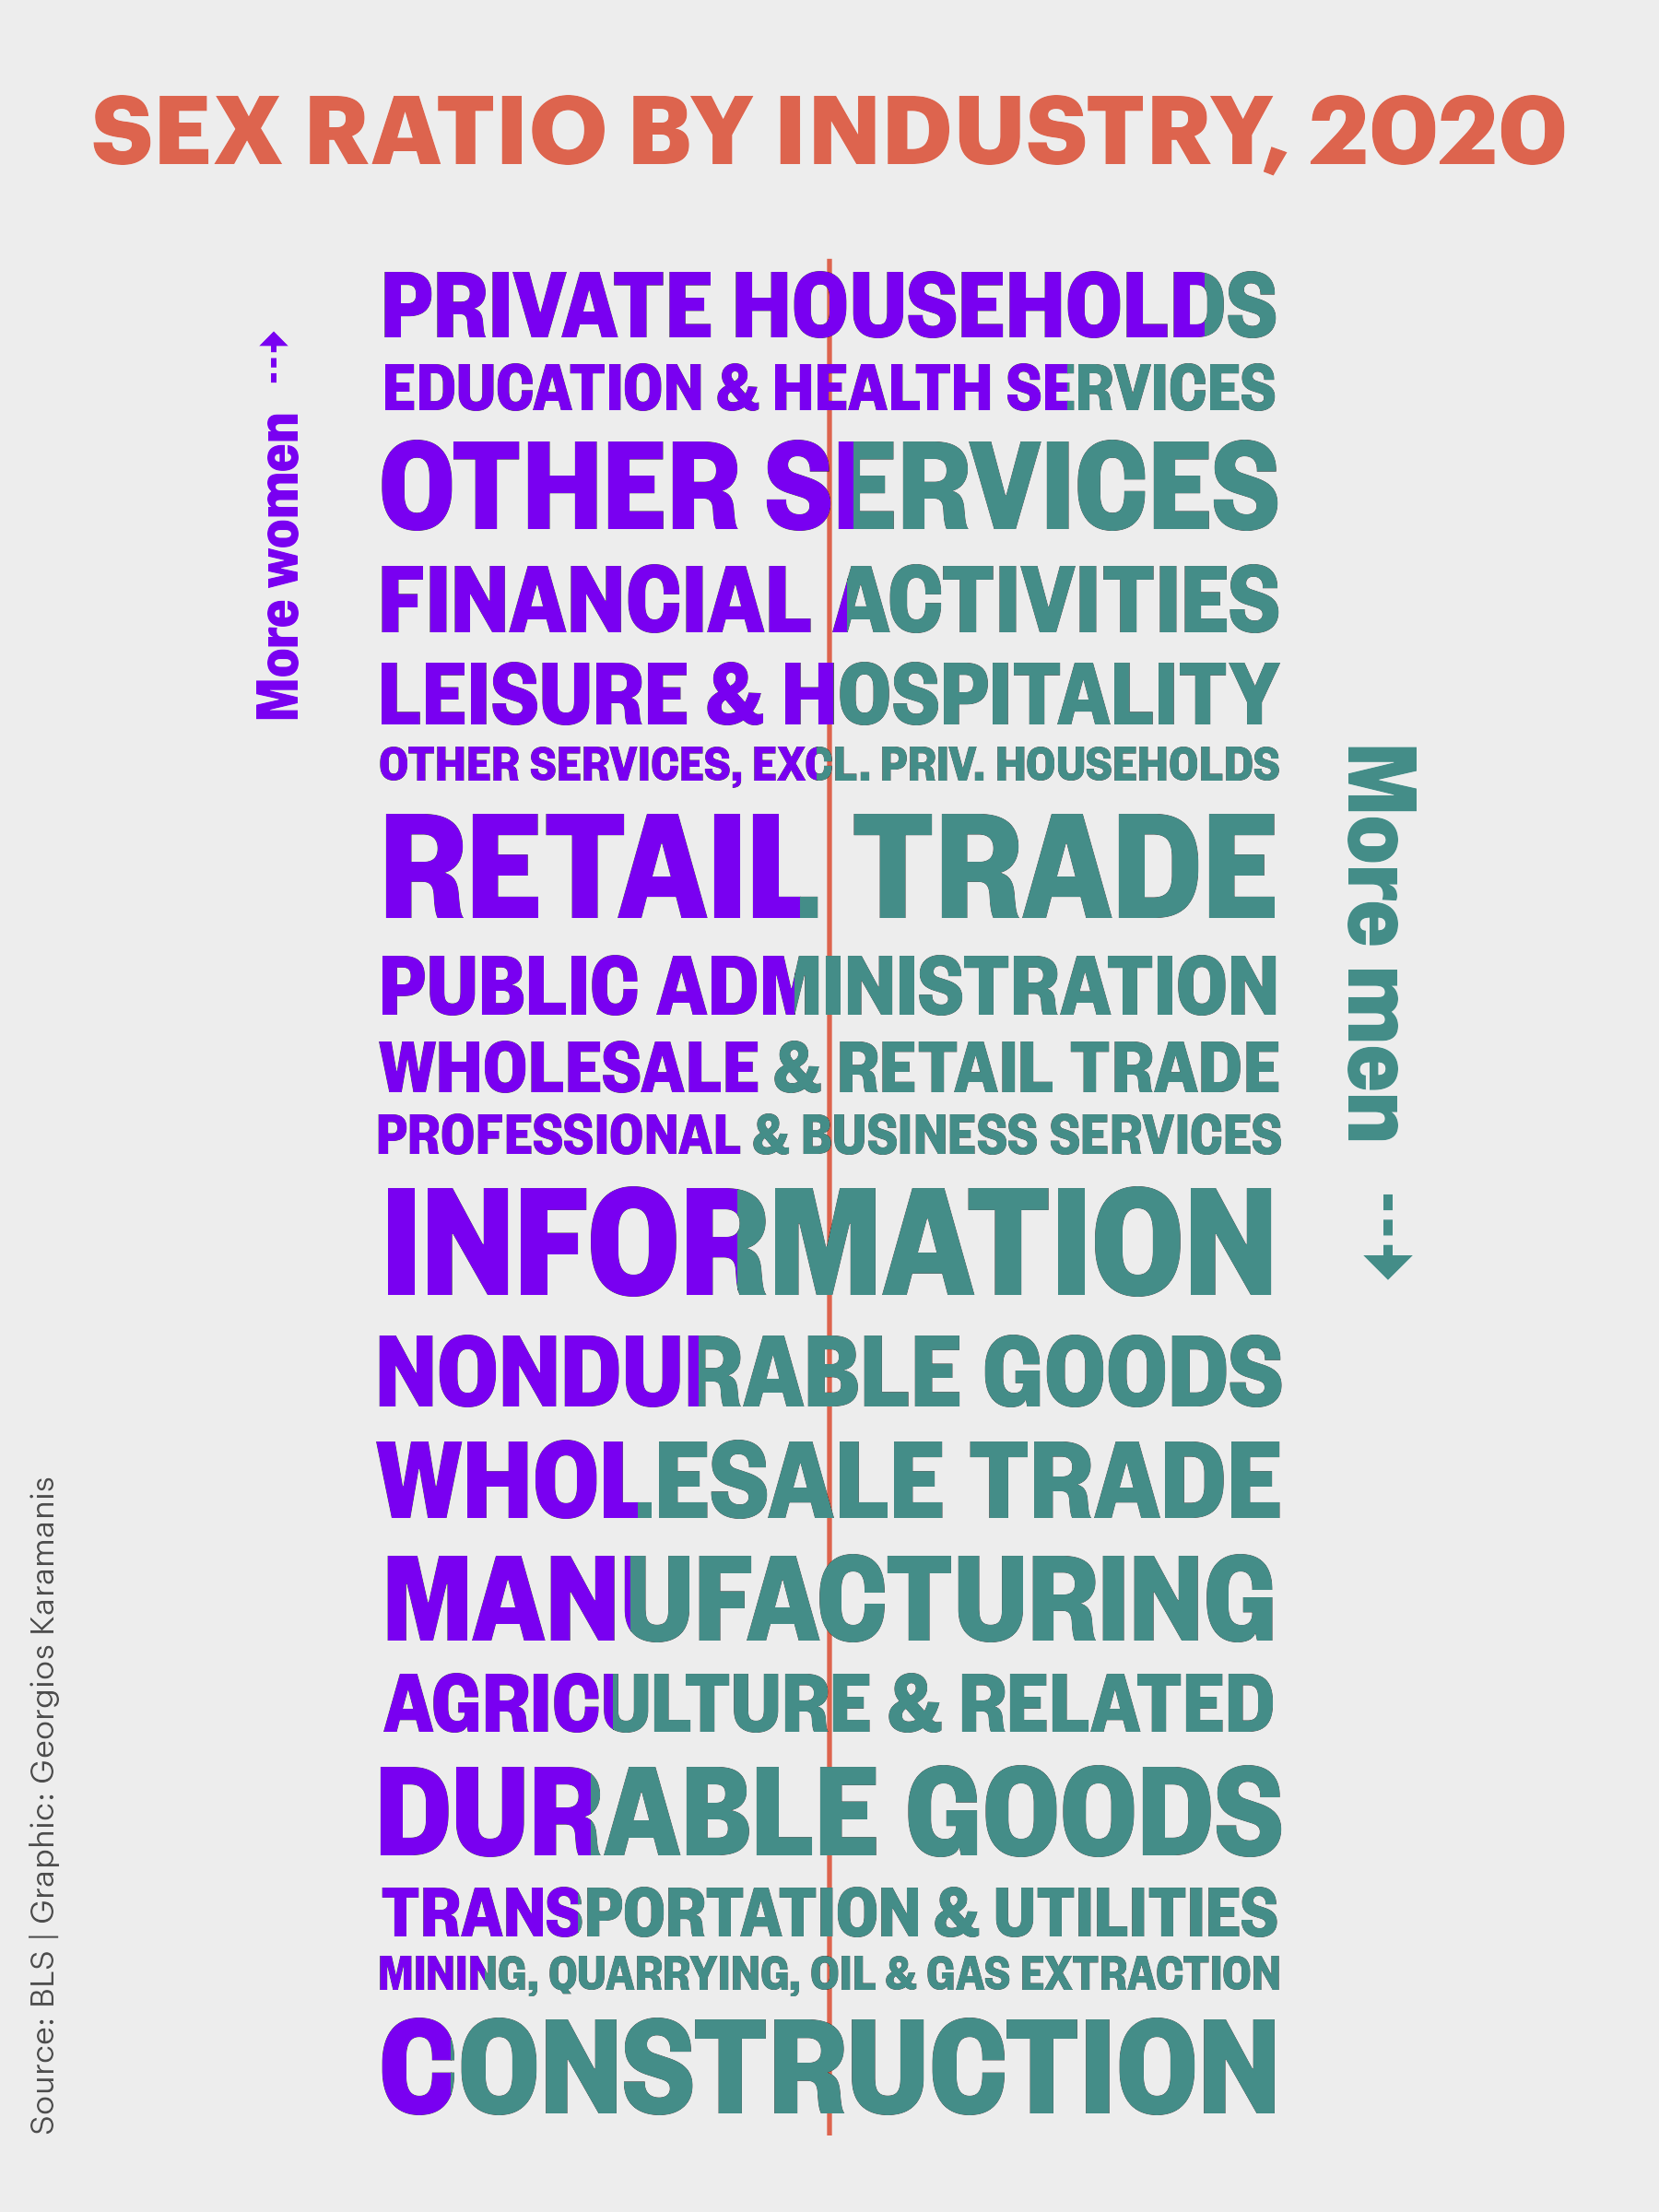
George Karamanis
Oct 4, 2021
sex ratio by industry
bar
text
colour
George Karamanis
Feb 23, 2021
No matching items
Back to top